 3
3peptides
spectra
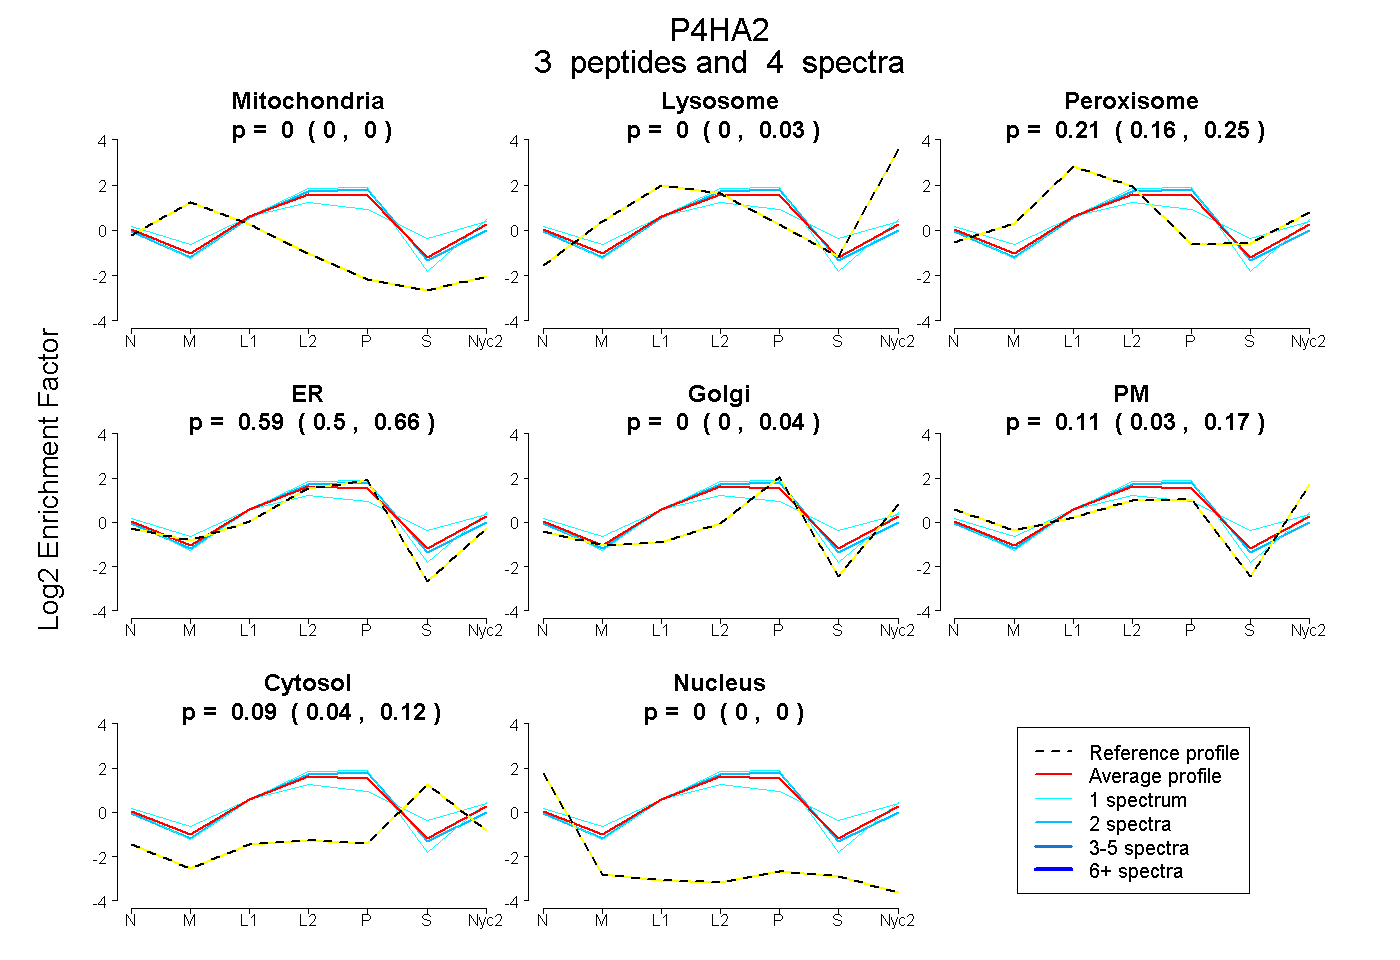
0.000 | 0.000
0.000 | 0.032
0.161 | 0.250
0.498 | 0.659
0.000 | 0.041
0.028 | 0.168
0.044 | 0.125
0.000 | 0.000
| Plot | Mito | Lyso | Perox | ER | Golgi | PM | Cytosol | Nucleus | |||||
| Expt A |
3 peptides |
4 spectra |
|
0.000 0.000 | 0.000 |
0.000 0.000 | 0.032 |
0.211 0.161 | 0.250 |
0.588 0.498 | 0.659 |
0.000 0.000 | 0.041 |
0.114 0.028 | 0.168 |
0.087 0.044 | 0.125 |
0.000 0.000 | 0.000 |
| 1 spectrum, SSWLEEDDDPVVAR | 0.000 | 0.065 | 0.089 | 0.740 | 0.000 | 0.098 | 0.008 | 0.000 | ||
| 2 spectra, GQEFLRPCGTTEVD | 0.000 | 0.000 | 0.180 | 0.751 | 0.000 | 0.000 | 0.069 | 0.000 | ||
| 1 spectrum, TGVLTVASYR | 0.000 | 0.000 | 0.315 | 0.279 | 0.000 | 0.217 | 0.189 | 0.000 |
| Plot | Lyso | Other | |||||||||||
| Expt C |
3 peptides |
4 spectra |
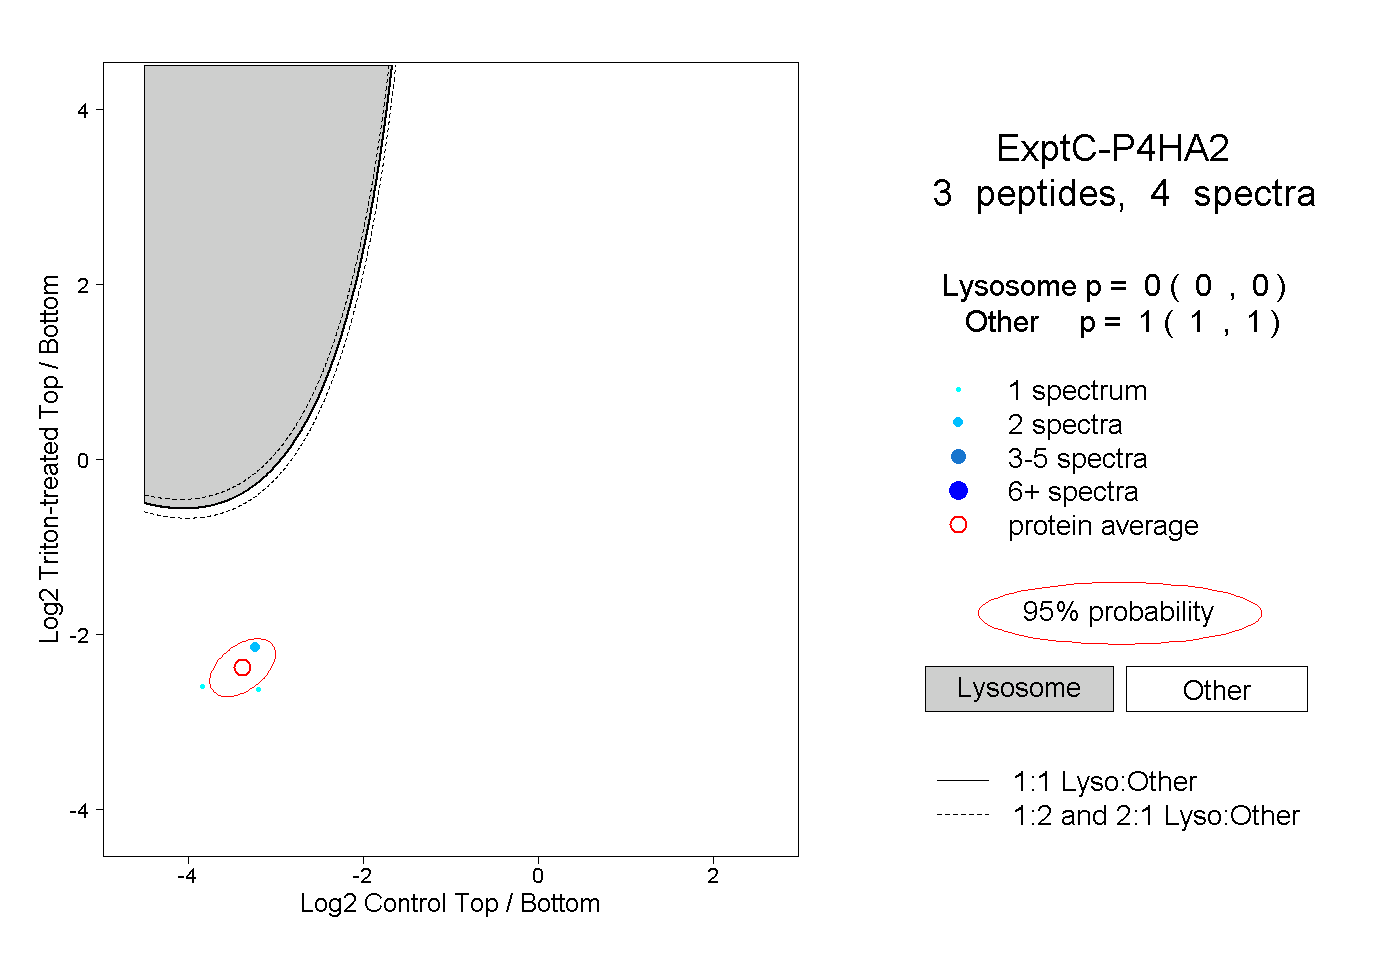 |
0.000 0.000 | 0.000 |
1.000 1.000 | 1.000 |