 3
3peptides
spectra
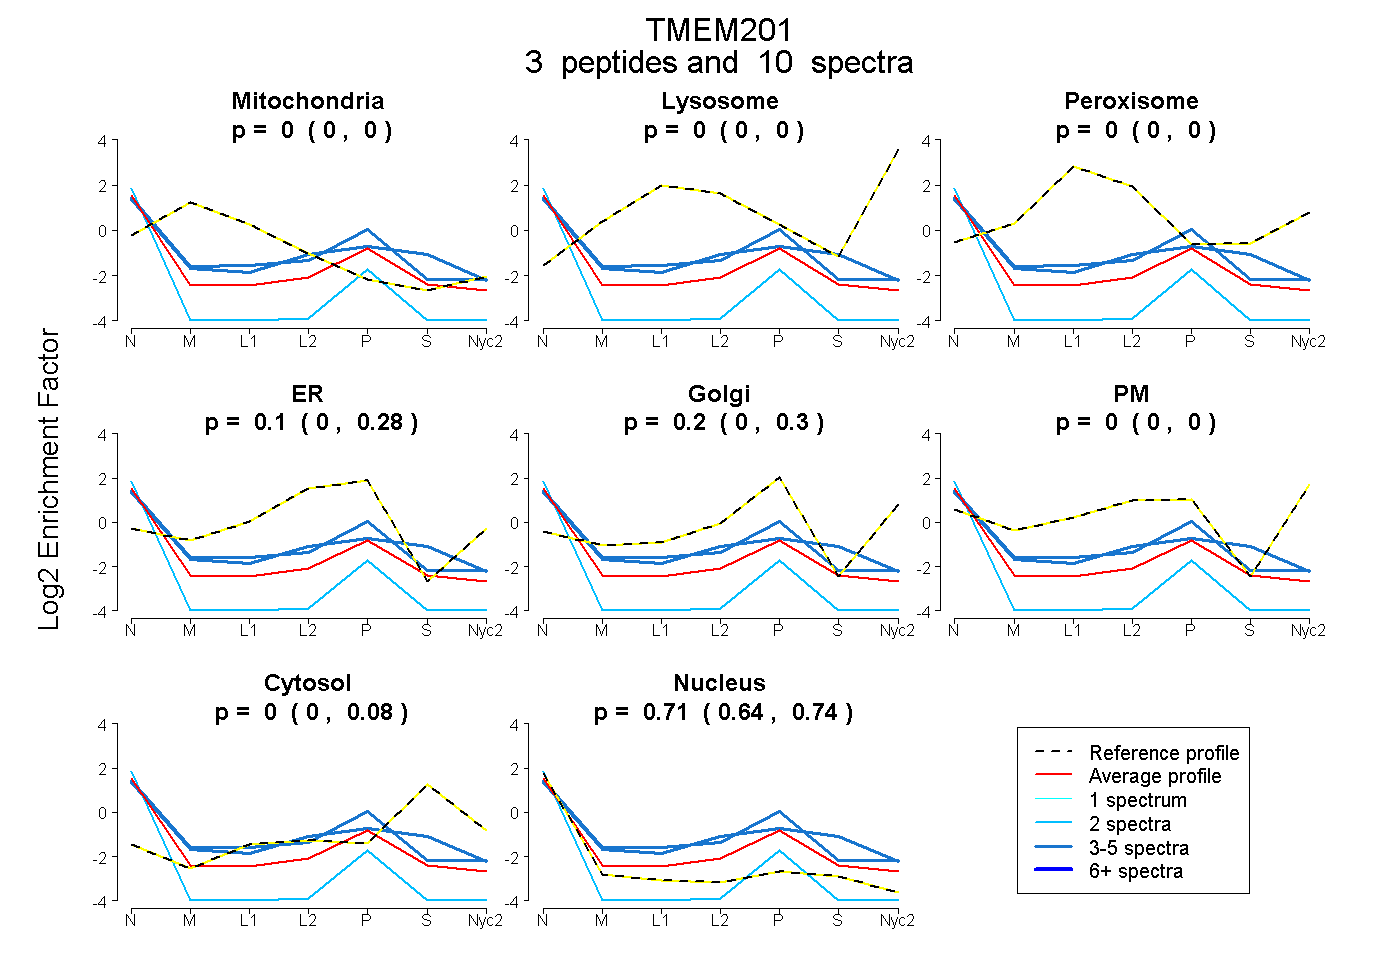
0.000 | 0.000
0.000 | 0.000
0.000 | 0.000
0.000 | 0.280
0.000 | 0.297
0.000 | 0.000
0.000 | 0.082
0.635 | 0.742
1peptide
spectra
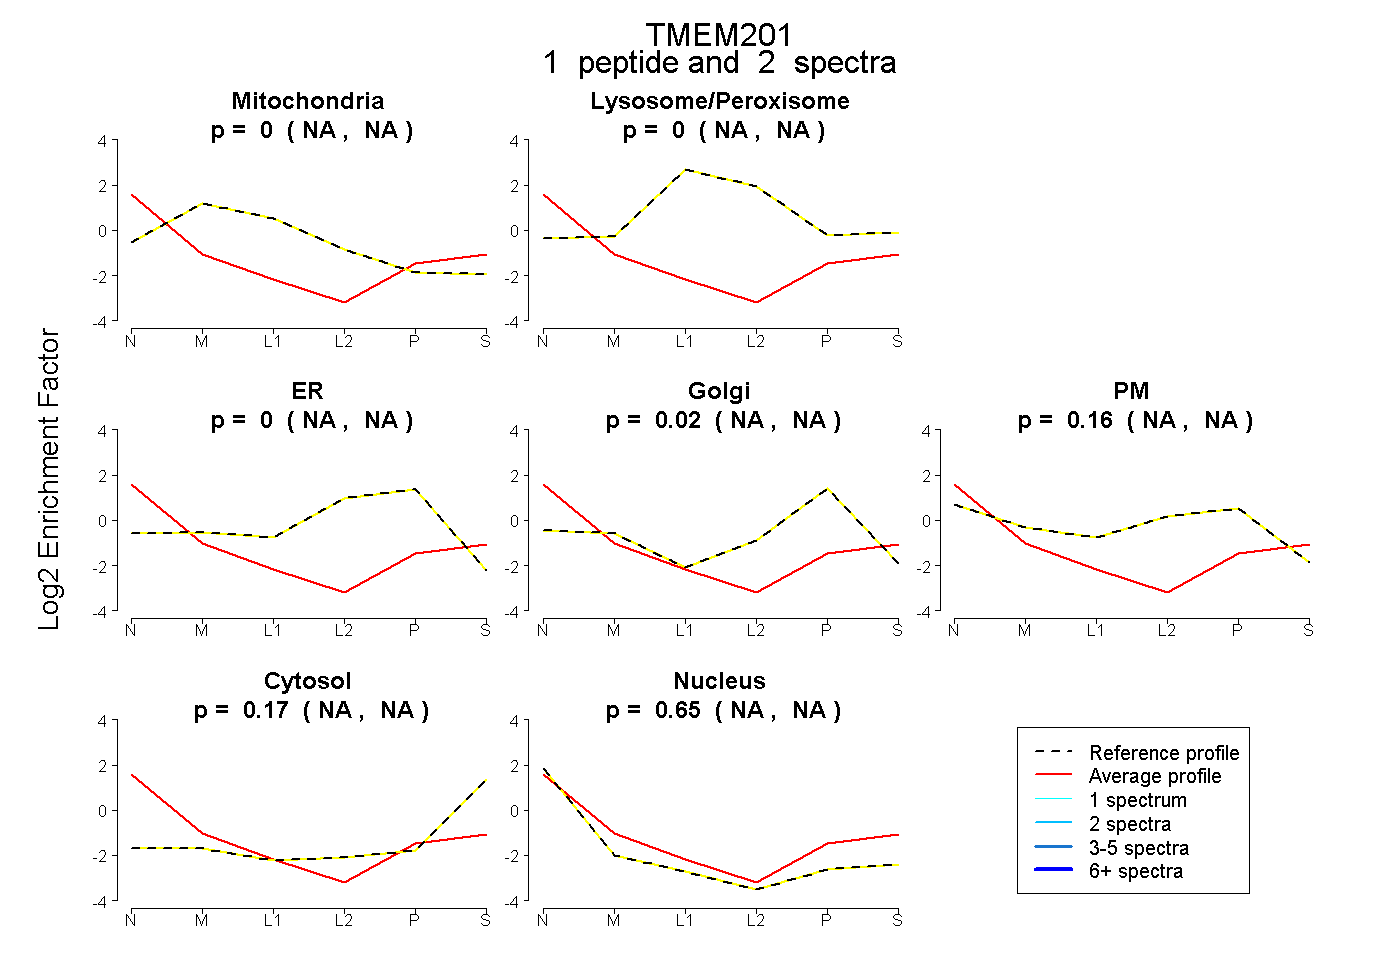
NA | NA
NA | NA
NA | NA
NA | NA
NA | NA
NA | NA
NA | NA
| Plot | Mito | Lyso | Perox | ER | Golgi | PM | Cytosol | Nucleus | |||||
| Expt A |
3 peptides |
10 spectra |
|
0.000 0.000 | 0.000 |
0.000 0.000 | 0.000 |
0.000 0.000 | 0.000 |
0.095 0.000 | 0.280 |
0.197 0.000 | 0.297 |
0.000 0.000 | 0.000 |
0.001 0.000 | 0.082 |
0.706 0.635 | 0.742 |
||
| Plot | Mito | Lyso or Perox | ER | Golgi | PM | Cytosol | Nucleus | ||||||
| Expt B |
1 peptide |
2 spectra |
|
0.000 NA | NA |
0.000 NA | NA |
0.000 NA | NA |
0.022 NA | NA |
0.161 NA | NA |
0.167 NA | NA |
0.650 NA | NA |