 20
20peptides
spectra
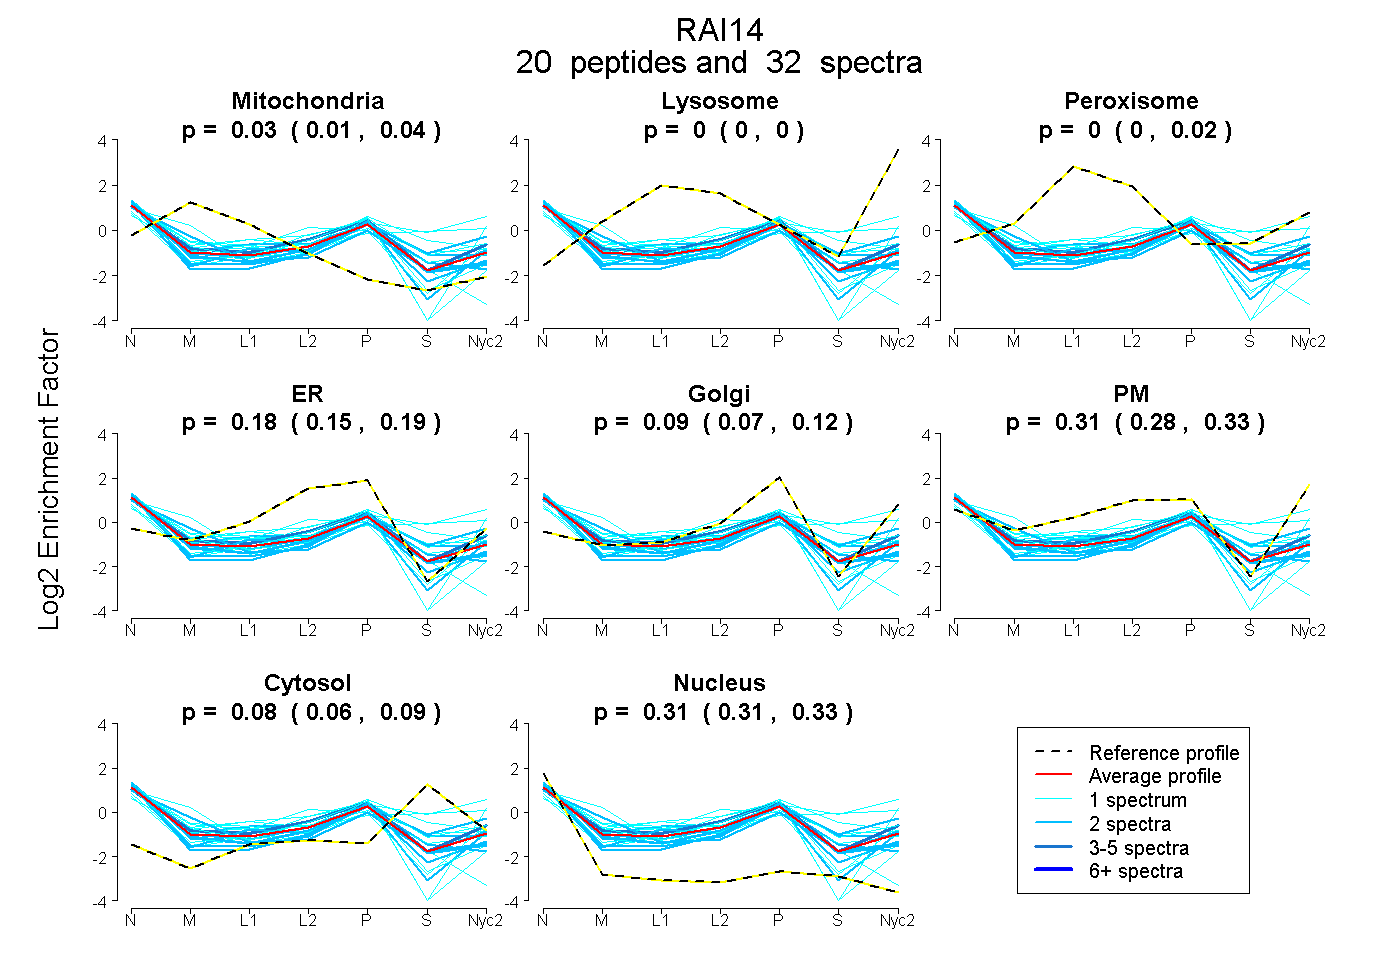
0.012 | 0.035
0.000 | 0.000
0.000 | 0.024
0.149 | 0.193
0.072 | 0.121
0.275 | 0.326
0.060 | 0.090
0.308 | 0.326
2peptides
spectra
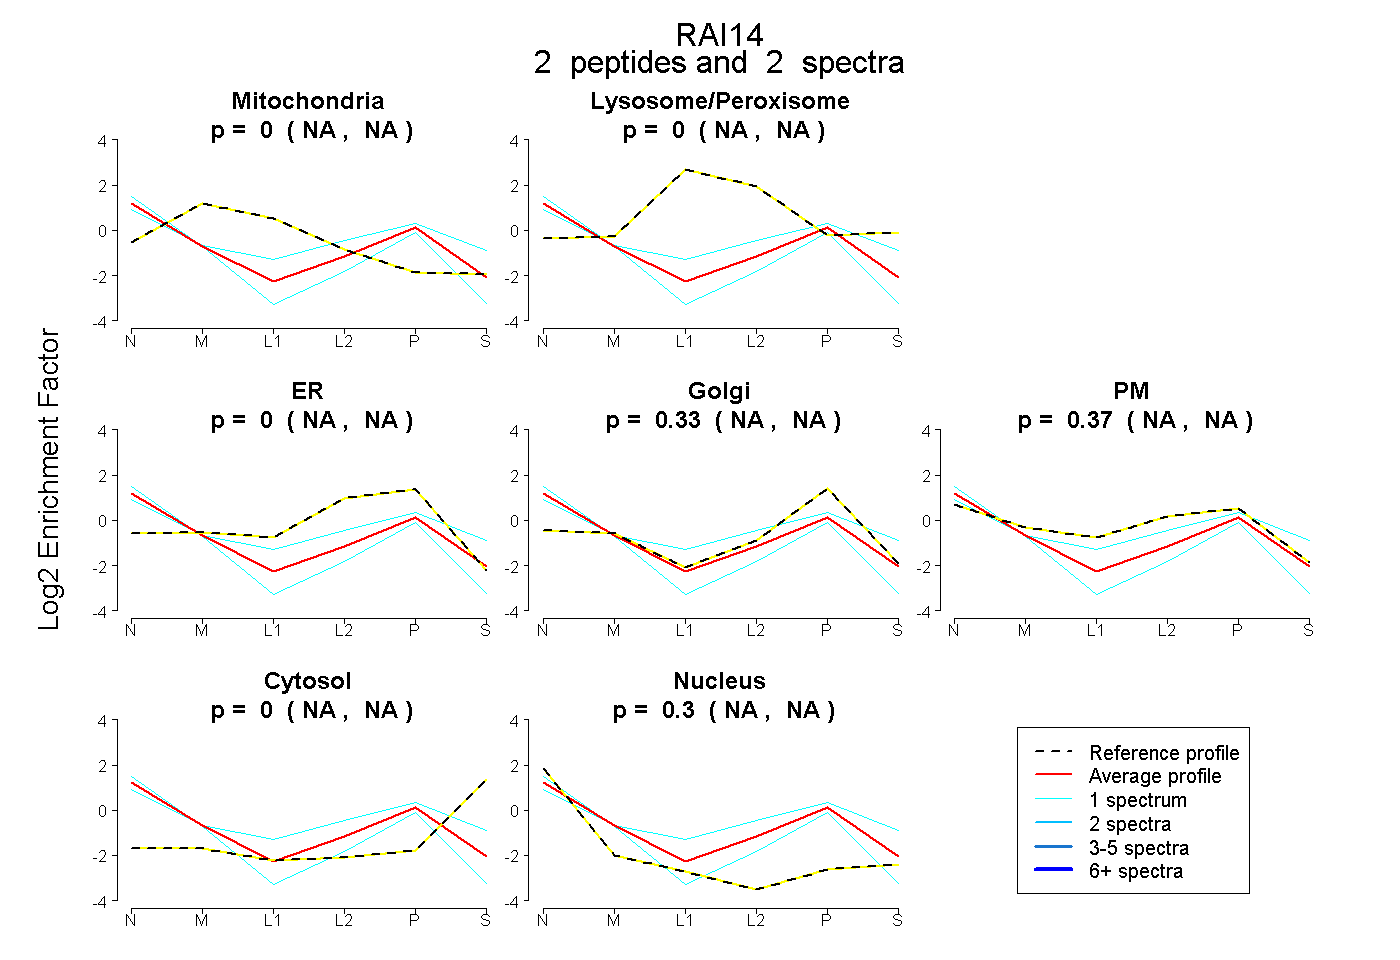
NA | NA
NA | NA
NA | NA
NA | NA
NA | NA
NA | NA
NA | NA
10peptides
spectra
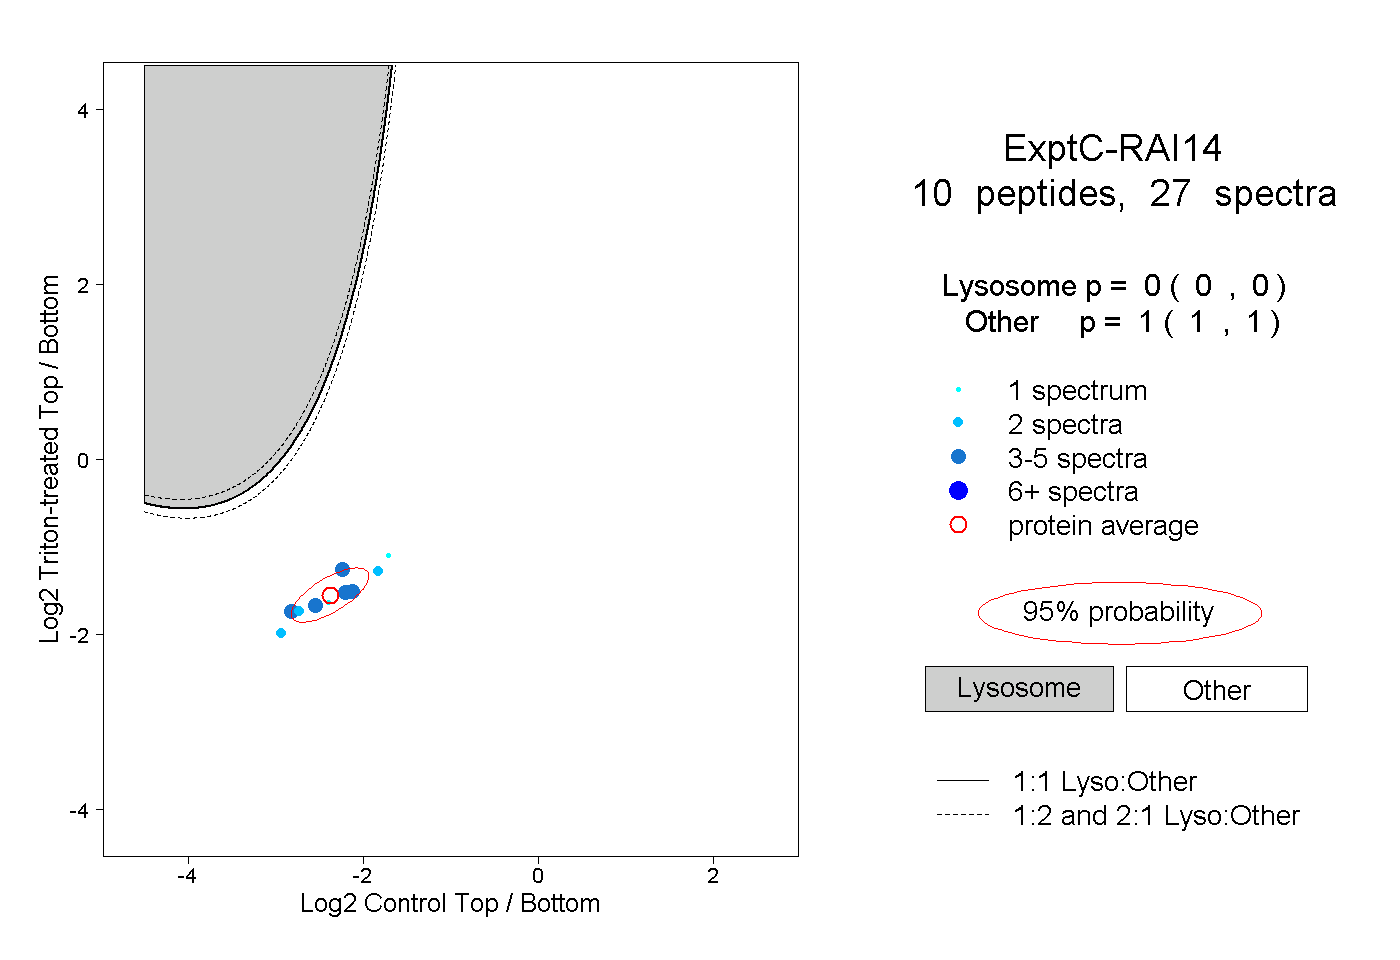
0.000 | 0.000
1.000 | 1.000
2peptides
spectra
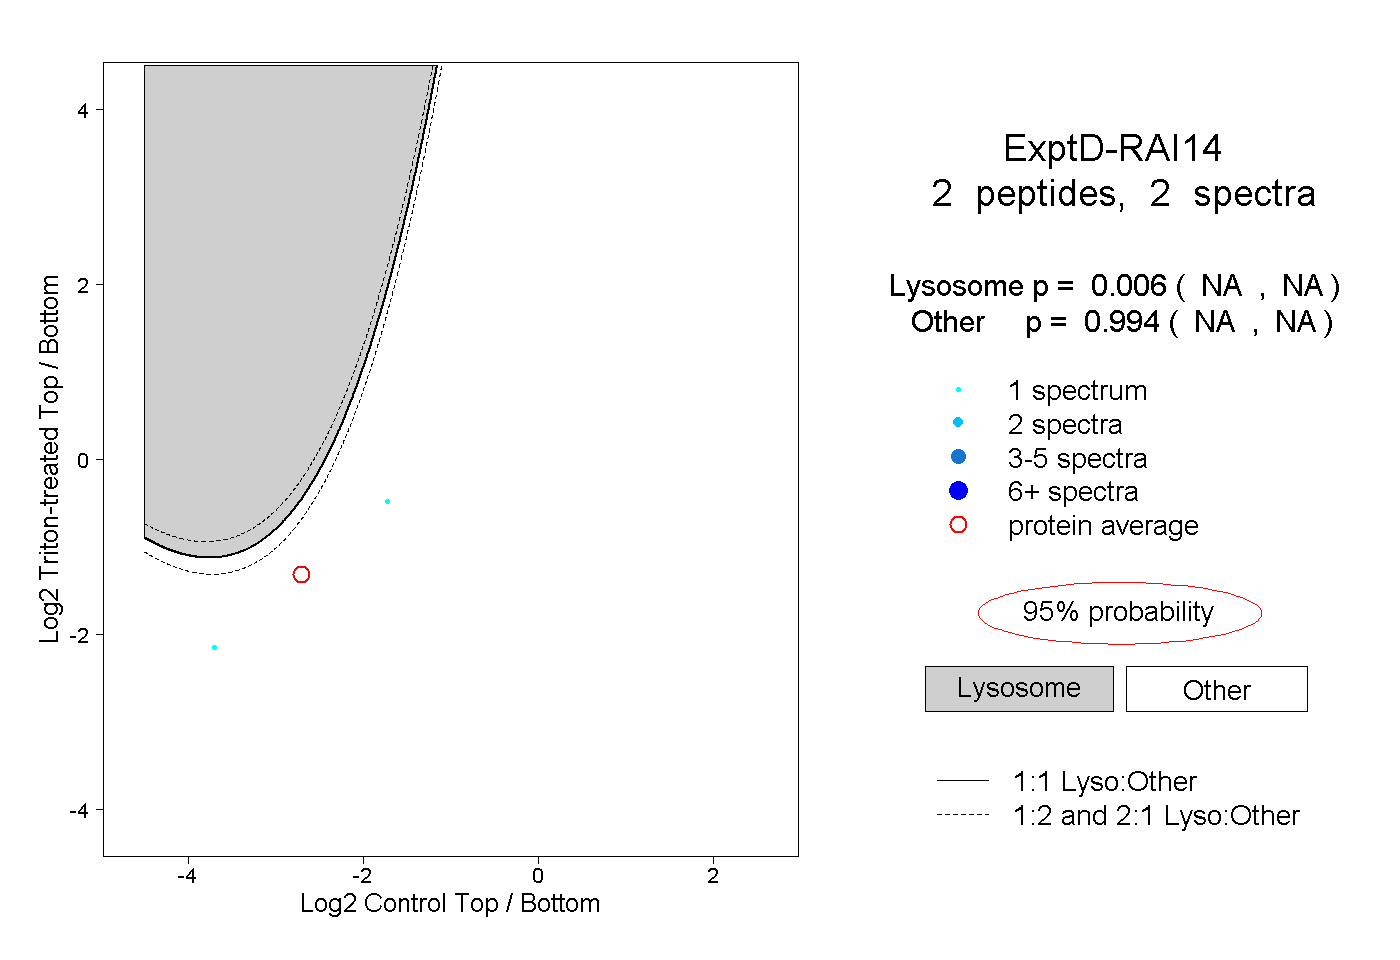
NA | NA
NA | NA