 3
3peptides
spectra
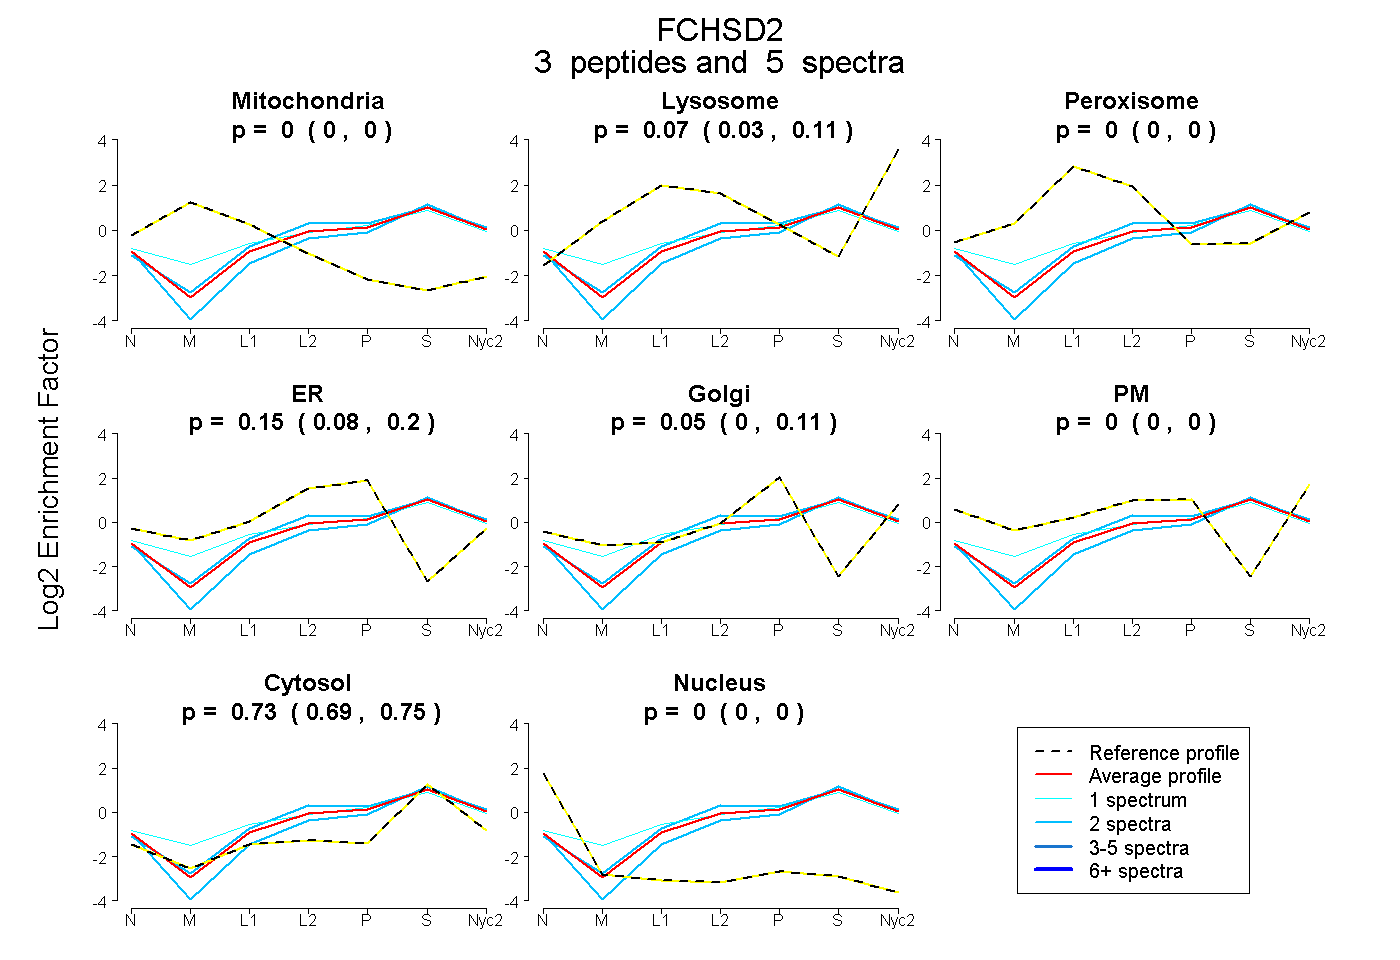
0.000 | 0.000
0.032 | 0.106
0.000 | 0.000
0.084 | 0.197
0.000 | 0.114
0.000 | 0.000
0.694 | 0.749
0.000 | 0.000
2peptides
spectra
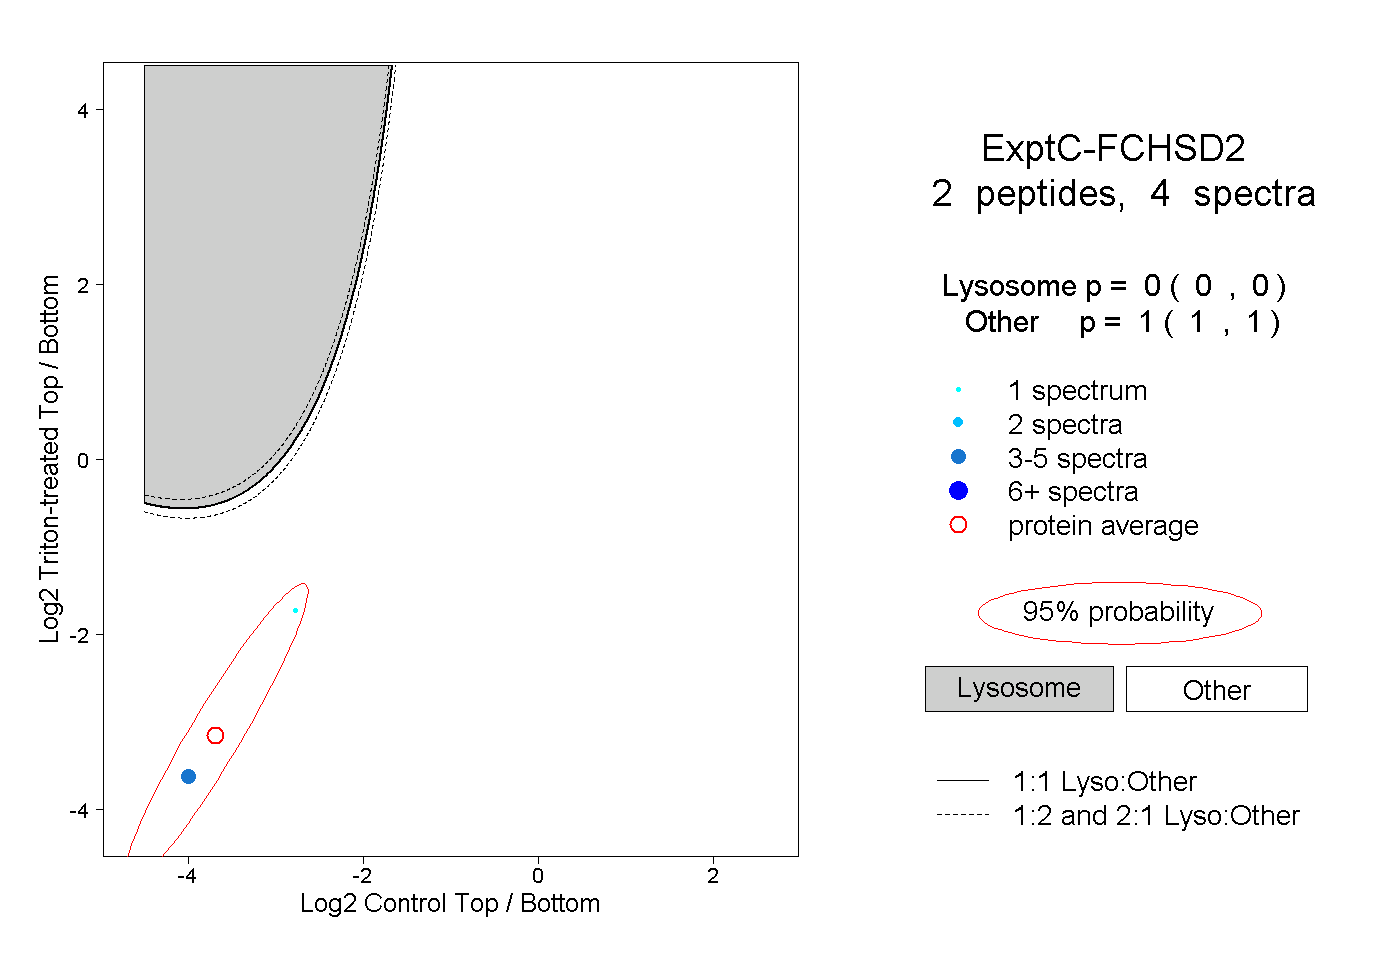
0.000 | 0.000
1.000 | 1.000
| Plot | Mito | Lyso | Perox | ER | Golgi | PM | Cytosol | Nucleus | |||||
| Expt A |
3 peptides |
5 spectra |
|
0.000 0.000 | 0.000 |
0.072 0.032 | 0.106 |
0.000 0.000 | 0.000 |
0.154 0.084 | 0.197 |
0.048 0.000 | 0.114 |
0.000 0.000 | 0.000 |
0.726 0.694 | 0.749 |
0.000 0.000 | 0.000 |
||
| Plot | Lyso | Other | |||||||||||
| Expt C |
2 peptides |
4 spectra |
|
0.000 0.000 | 0.000 |
1.000 1.000 | 1.000 |