 1
1peptide
spectrum
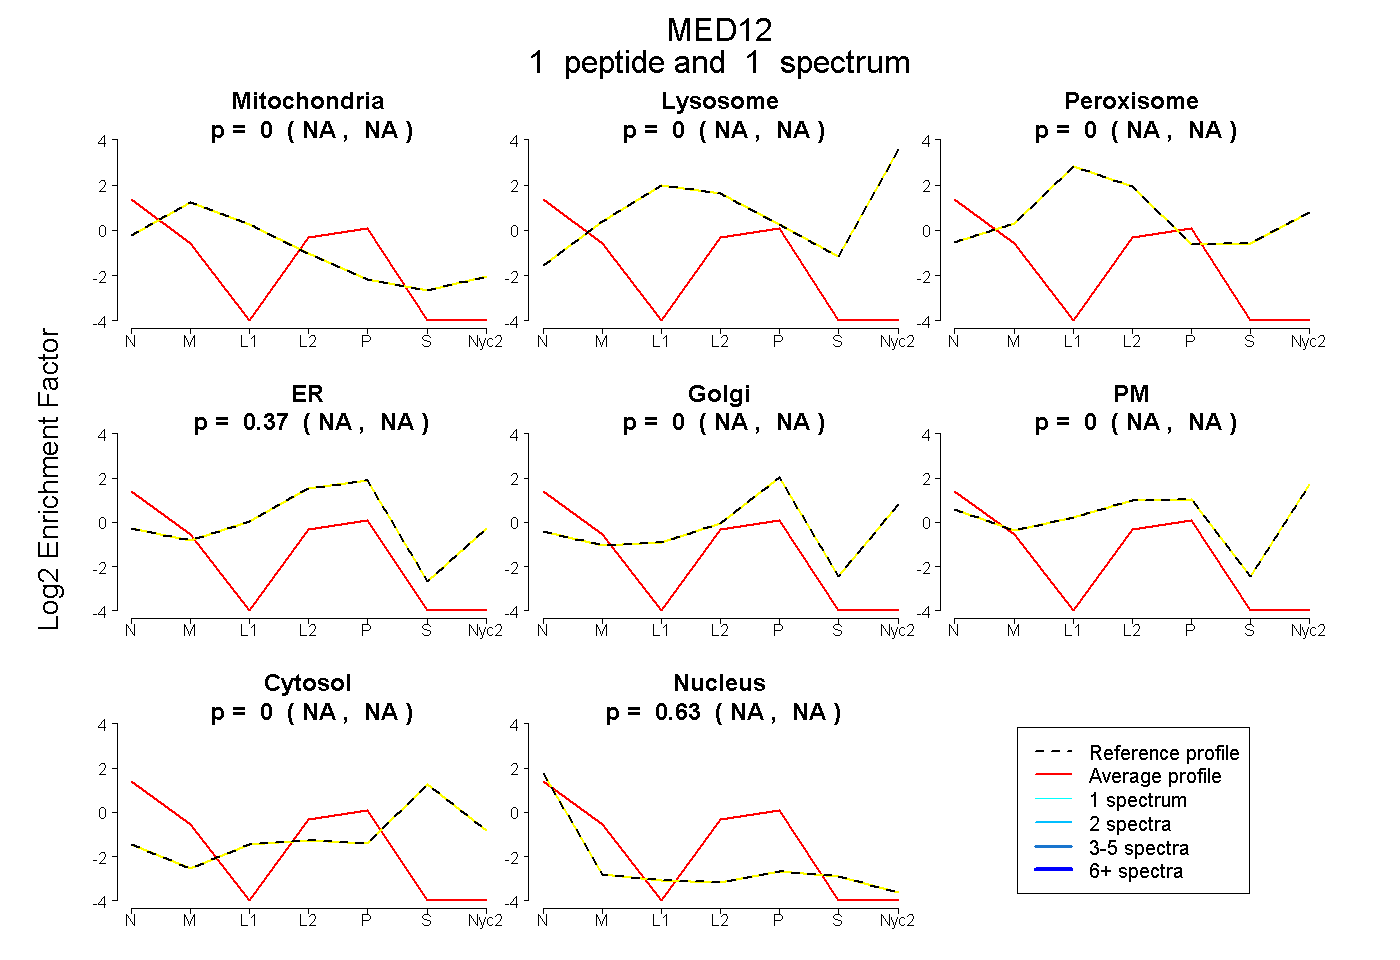
NA | NA
NA | NA
NA | NA
NA | NA
NA | NA
NA | NA
NA | NA
NA | NA
1peptide
spectra
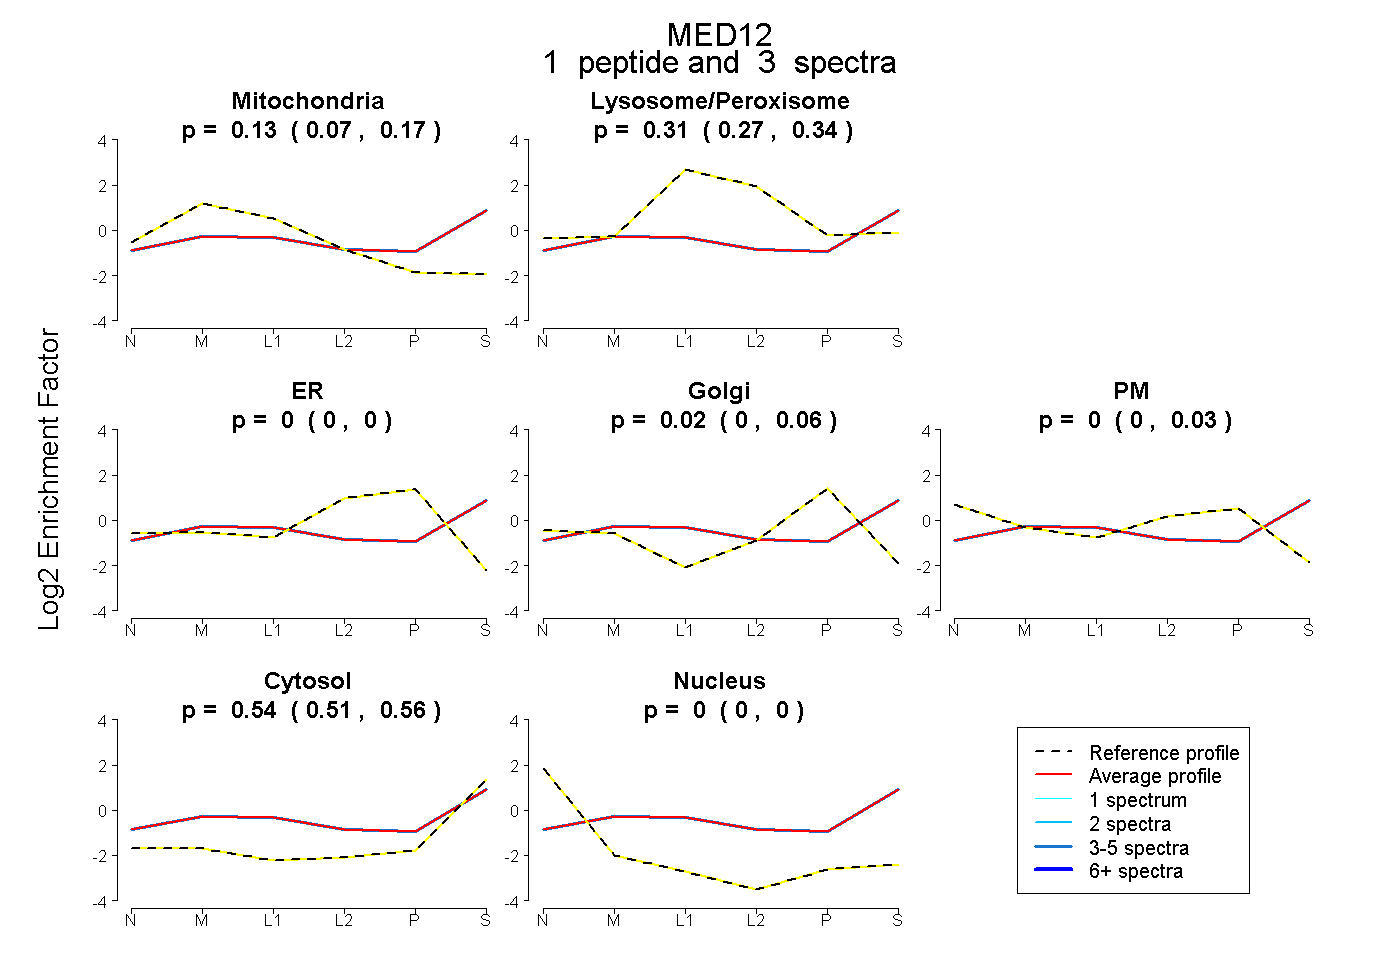
0.073 | 0.167
0.274 | 0.339
0.000 | 0.000
0.000 | 0.057
0.000 | 0.033
0.510 | 0.562
0.000 | 0.000
2peptides
spectra
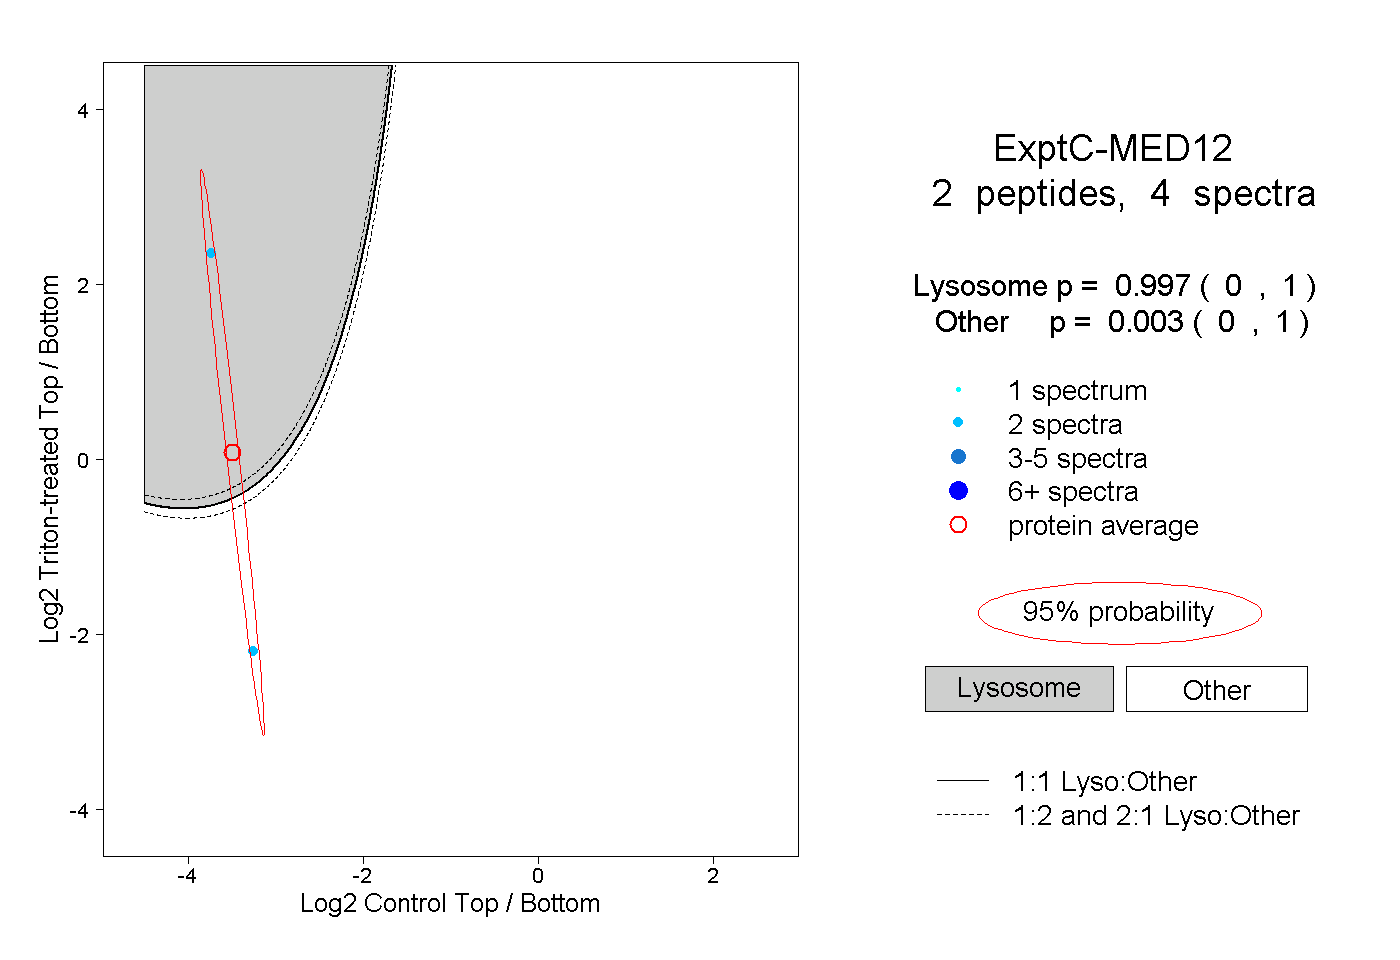
0.000 | 1.000
0.000 | 1.000