16
16peptides
spectra
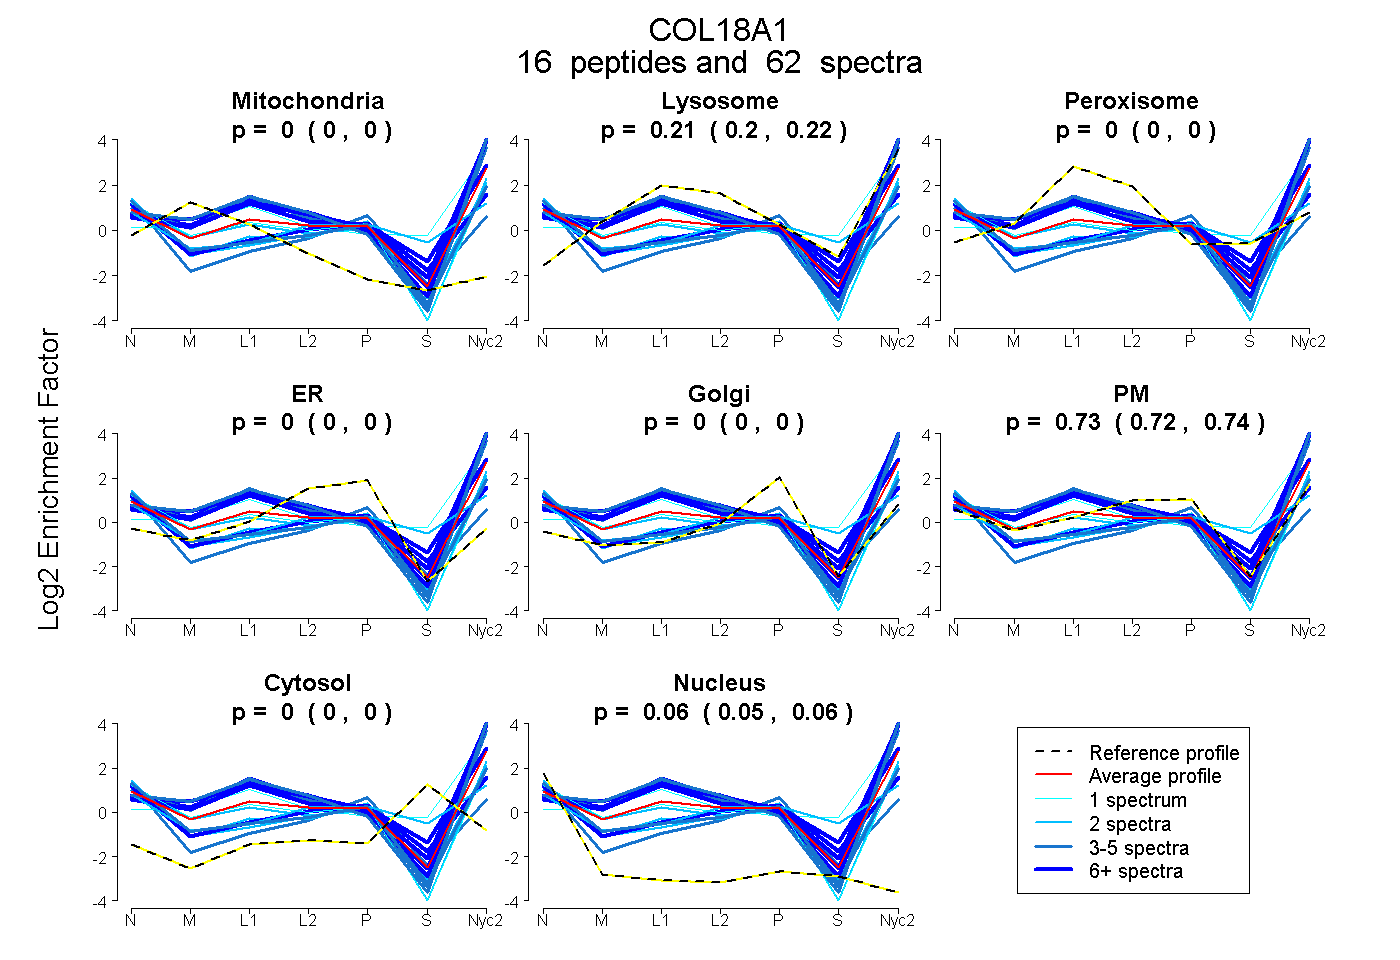
0.000 | 0.000
0.197 | 0.218
0.000 | 0.000
0.000 | 0.000
0.000 | 0.000
0.721 | 0.745
0.000 | 0.000
0.053 | 0.062
9peptides
spectra
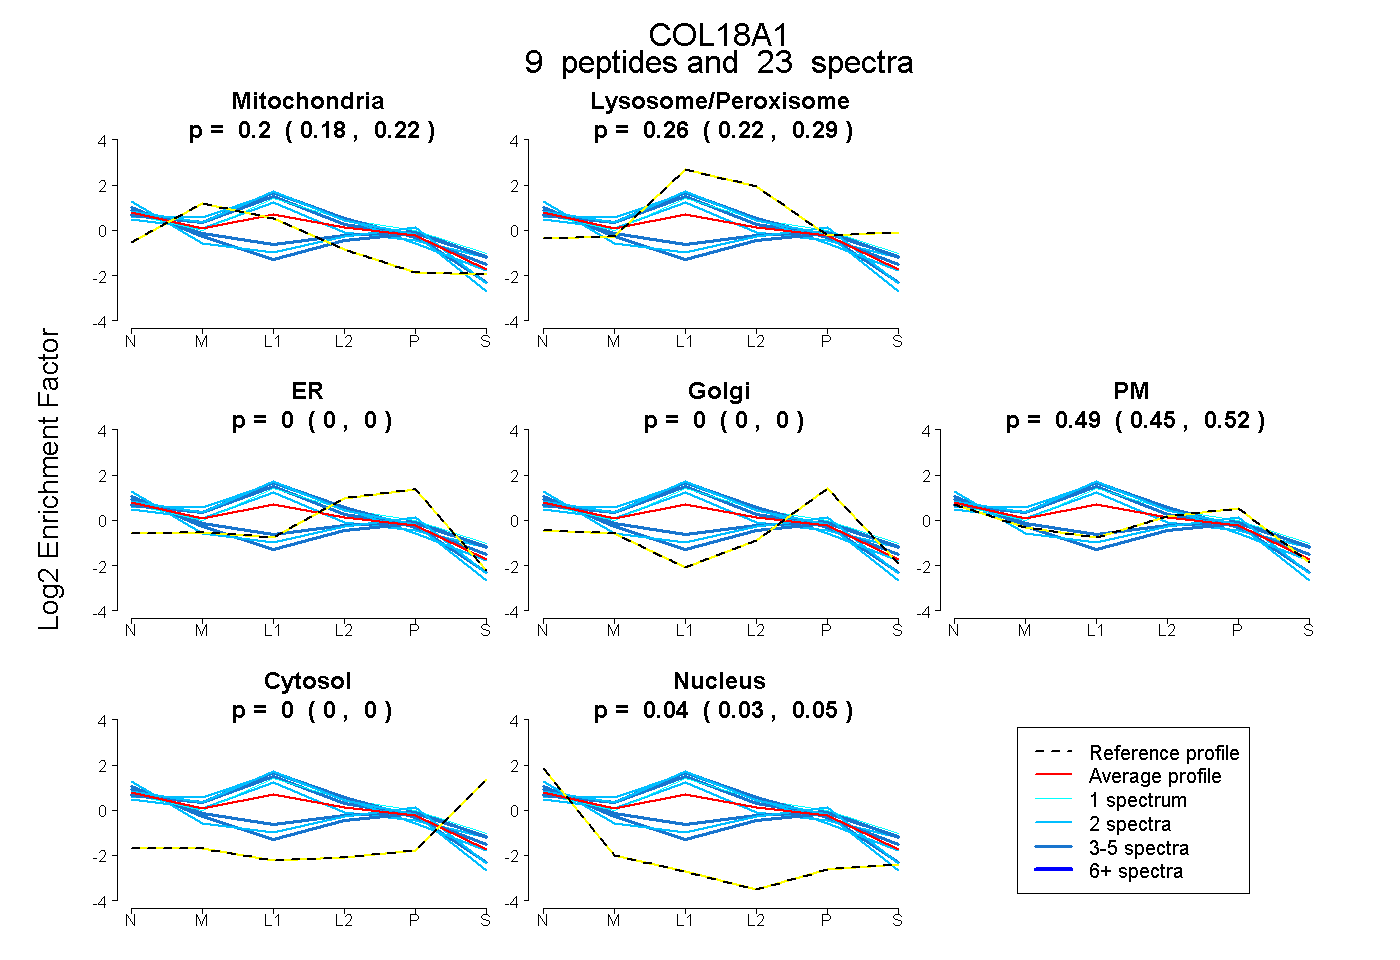
0.184 | 0.219
0.225 | 0.289
0.000 | 0.000
0.000 | 0.000
0.452 | 0.523
0.000 | 0.000
0.032 | 0.054