 3
3peptides
spectra
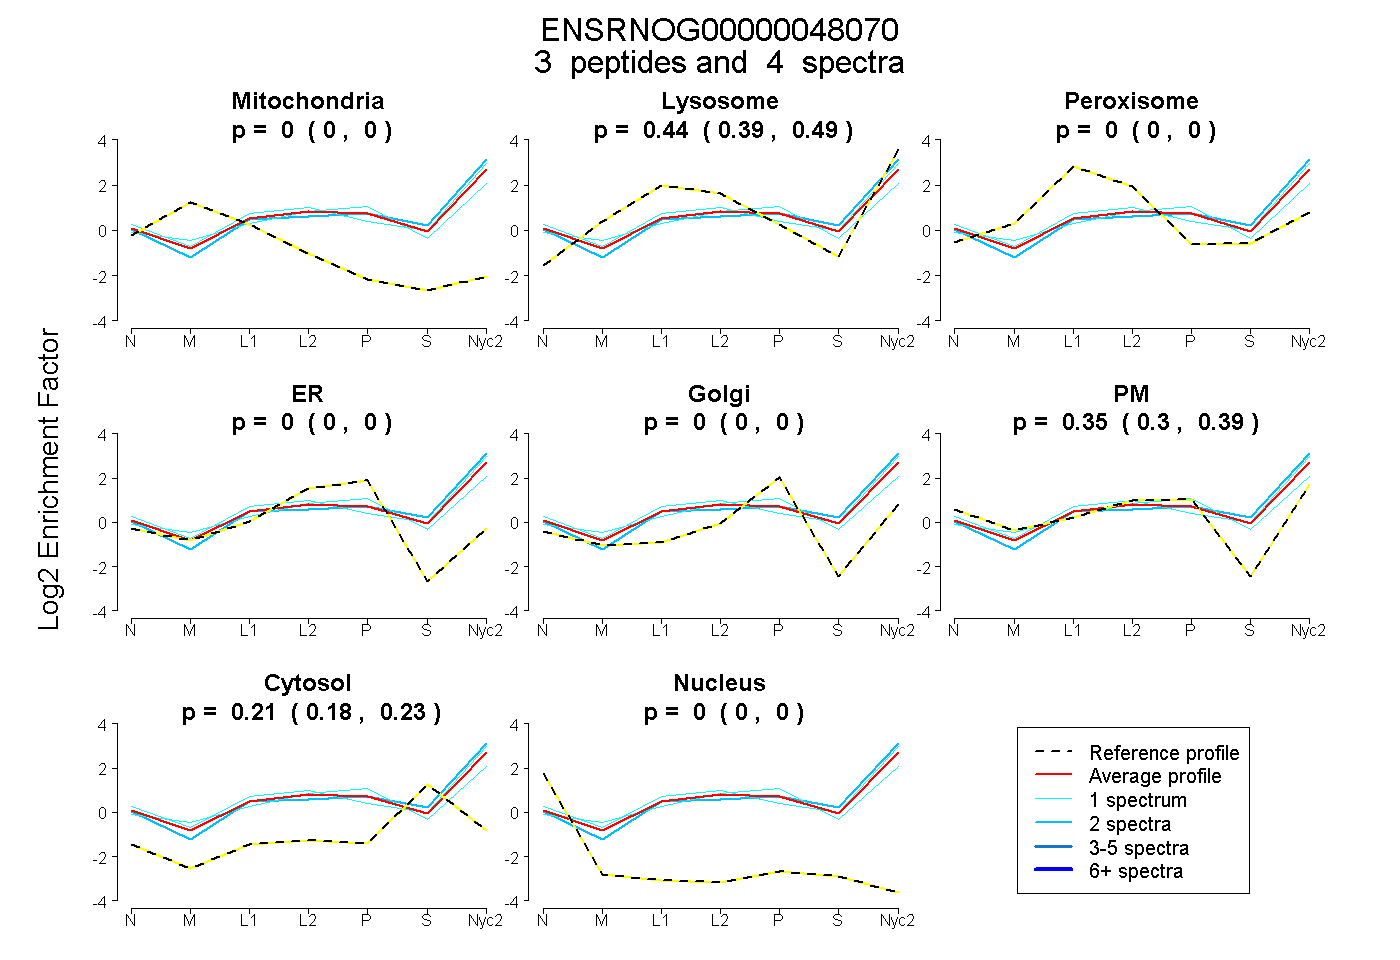
0.000 | 0.000
0.394 | 0.488
0.000 | 0.000
0.000 | 0.000
0.000 | 0.000
0.300 | 0.386
0.176 | 0.233
0.000 | 0.000
| Plot | Mito | Lyso | Perox | ER | Golgi | PM | Cytosol | Nucleus | |||||
| Expt A |
3 peptides |
4 spectra |
|
0.000 0.000 | 0.000 |
0.443 0.394 | 0.488 |
0.000 0.000 | 0.000 |
0.000 0.000 | 0.000 |
0.000 0.000 | 0.000 |
0.349 0.300 | 0.386 |
0.208 0.176 | 0.233 |
0.000 0.000 | 0.000 |
| 1 spectrum, NYLAWYQQKPGQSPK | 0.000 | 0.510 | 0.000 | 0.000 | 0.000 | 0.307 | 0.182 | 0.000 | ||
| 1 spectrum, VTMSCK | 0.000 | 0.340 | 0.000 | 0.000 | 0.038 | 0.430 | 0.192 | 0.000 | ||
| 2 spectra, LLISWASTR | 0.000 | 0.489 | 0.000 | 0.000 | 0.000 | 0.269 | 0.241 | 0.000 |
| Plot | Lyso | Other | |||||||||||
| Expt C |
2 peptides |
5 spectra |
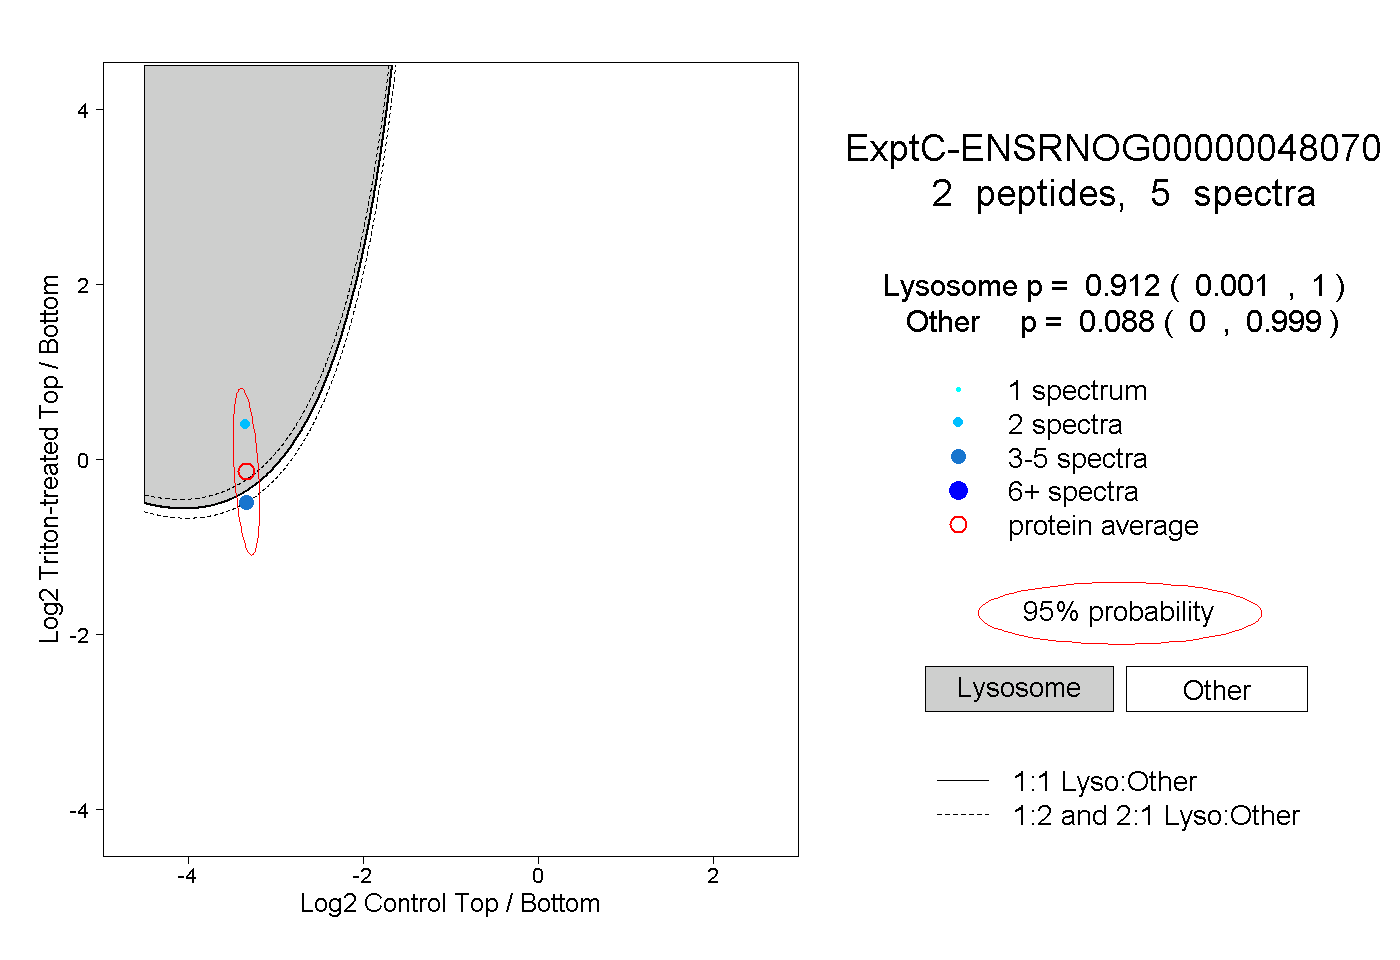 |
0.912 0.001 | 1.000 |
0.088 0.000 | 0.999 |