 1
1peptide
spectra
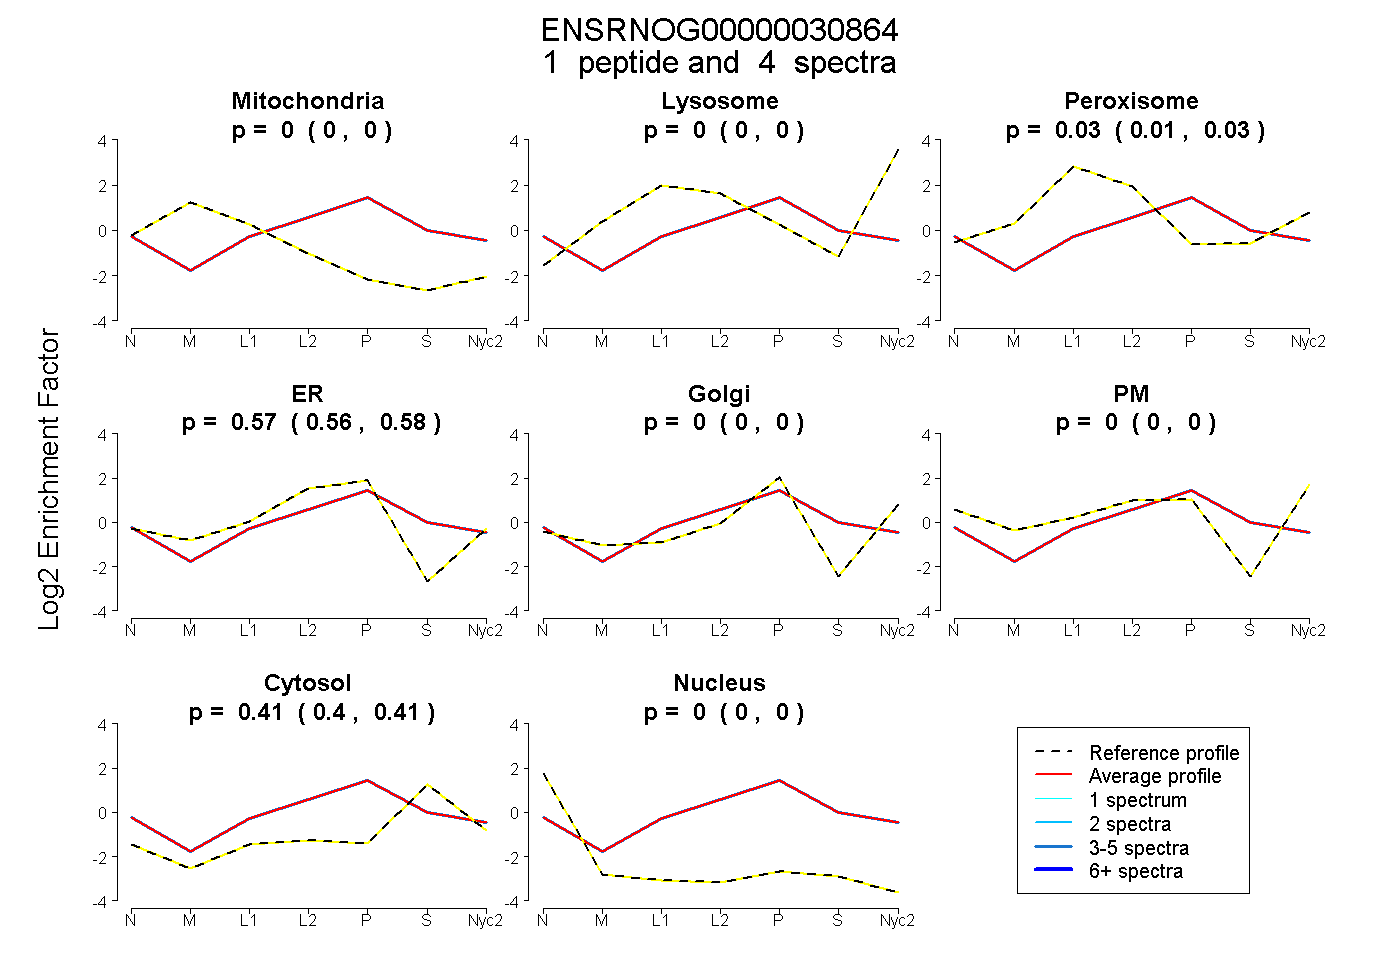
0.000 | 0.000
0.000 | 0.000
0.014 | 0.035
0.563 | 0.576
0.000 | 0.000
0.000 | 0.000
0.398 | 0.410
0.000 | 0.000
1peptide
spectra
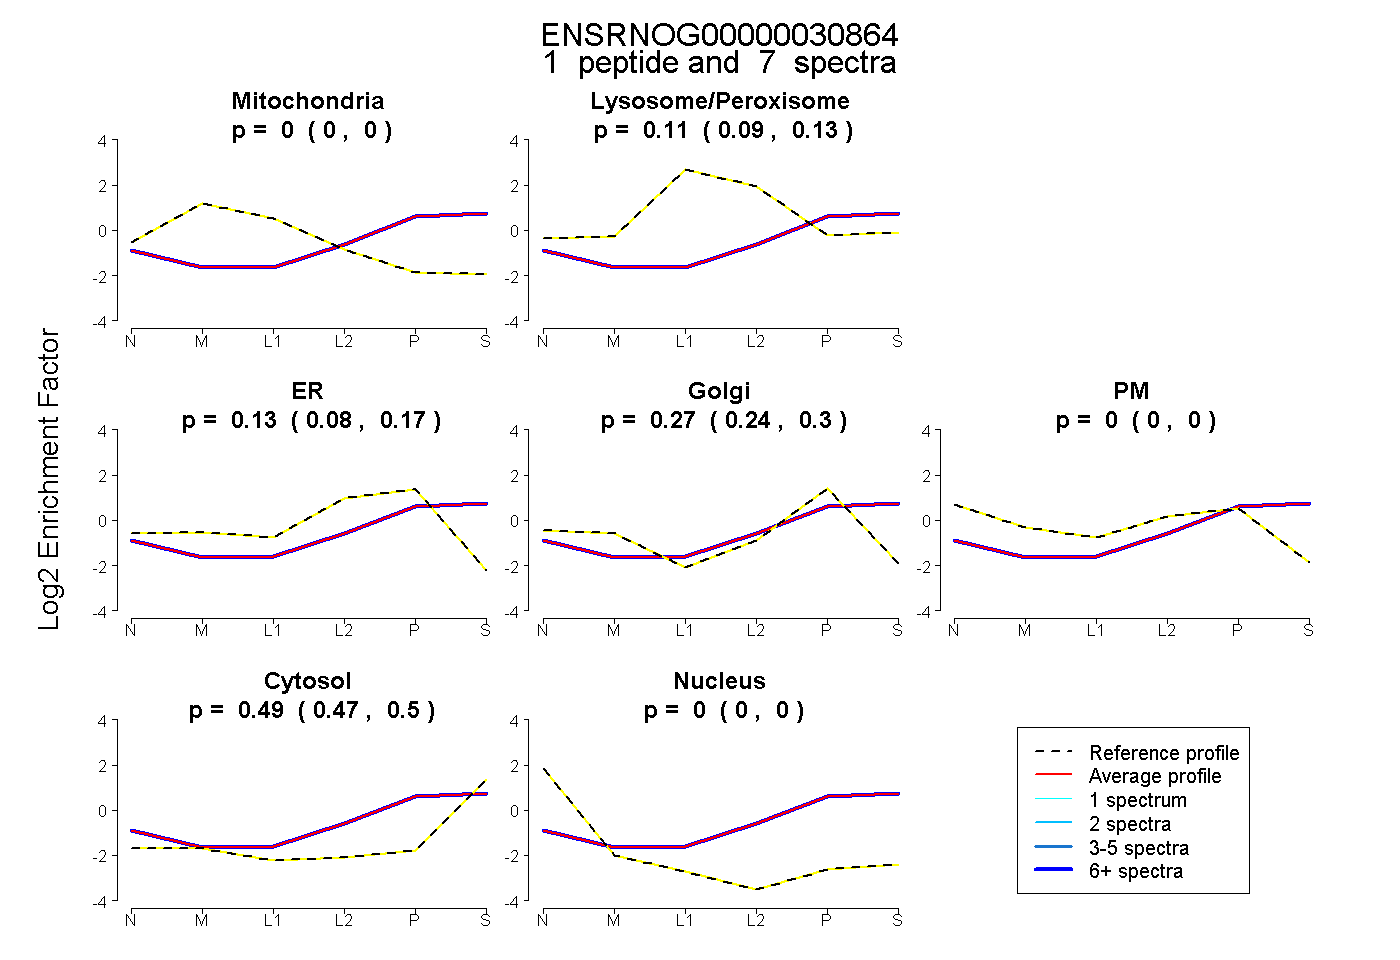
0.000 | 0.000
0.089 | 0.131
0.084 | 0.166
0.236 | 0.303
0.000 | 0.000
0.474 | 0.500
0.000 | 0.000
1peptide
spectrum
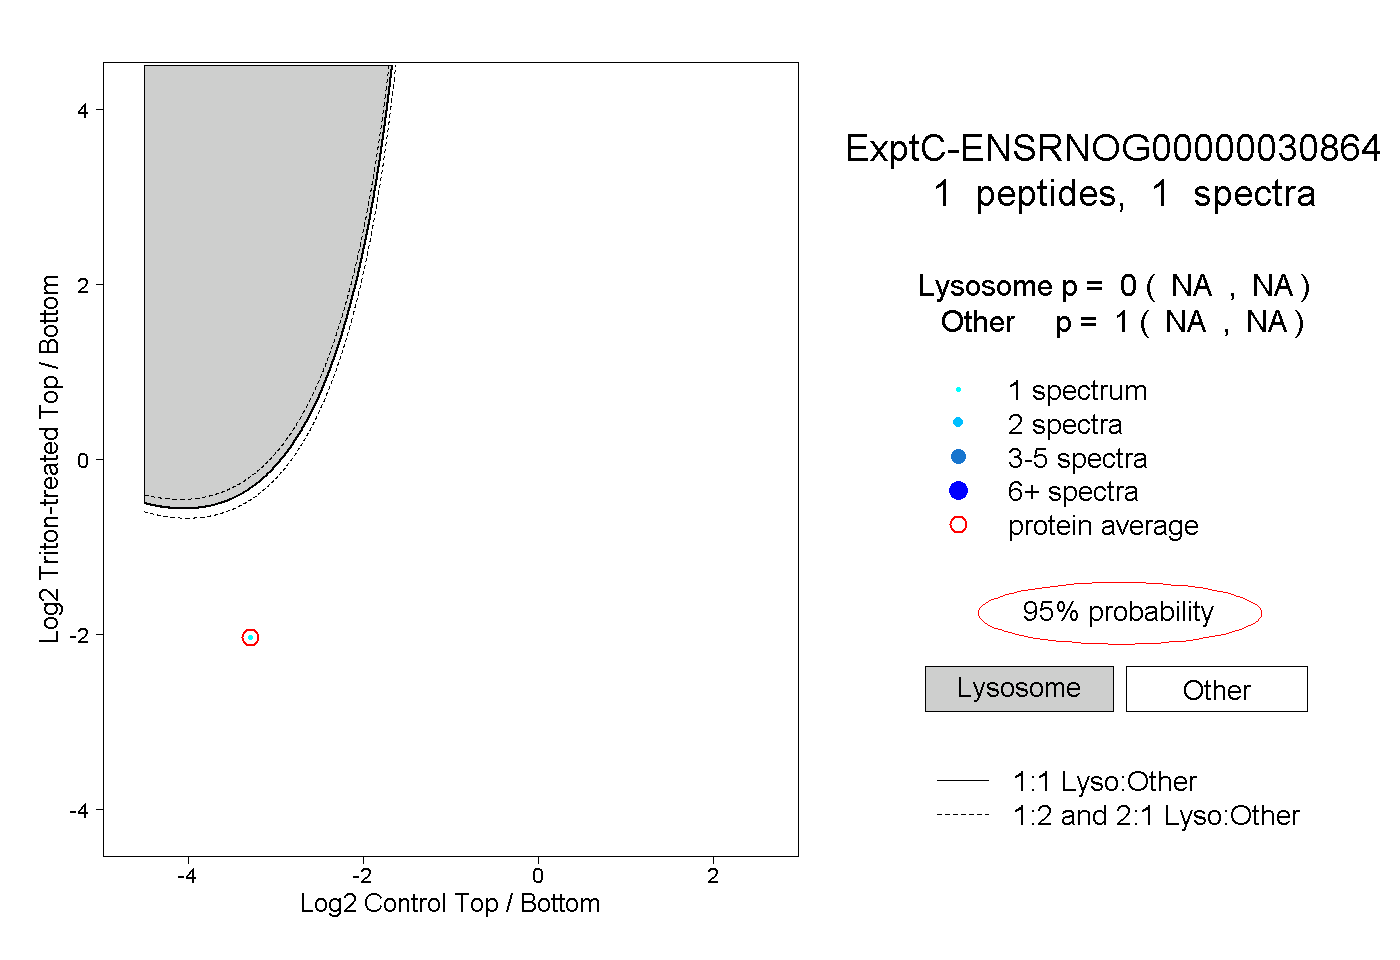
NA | NA
NA | NA