 2
2peptides
spectra
0.466 | 0.580
0.124 | 0.188
0.000 | 0.070
0.000 | 0.108
0.000 | 0.224
0.026 | 0.205
0.000 | 0.083
0.000 | 0.000
8peptides
spectra
0.000 | 0.000
1.000 | 1.000
| Plot | Mito | Lyso | Perox | ER | Golgi | PM | Cytosol | Nucleus | |||||
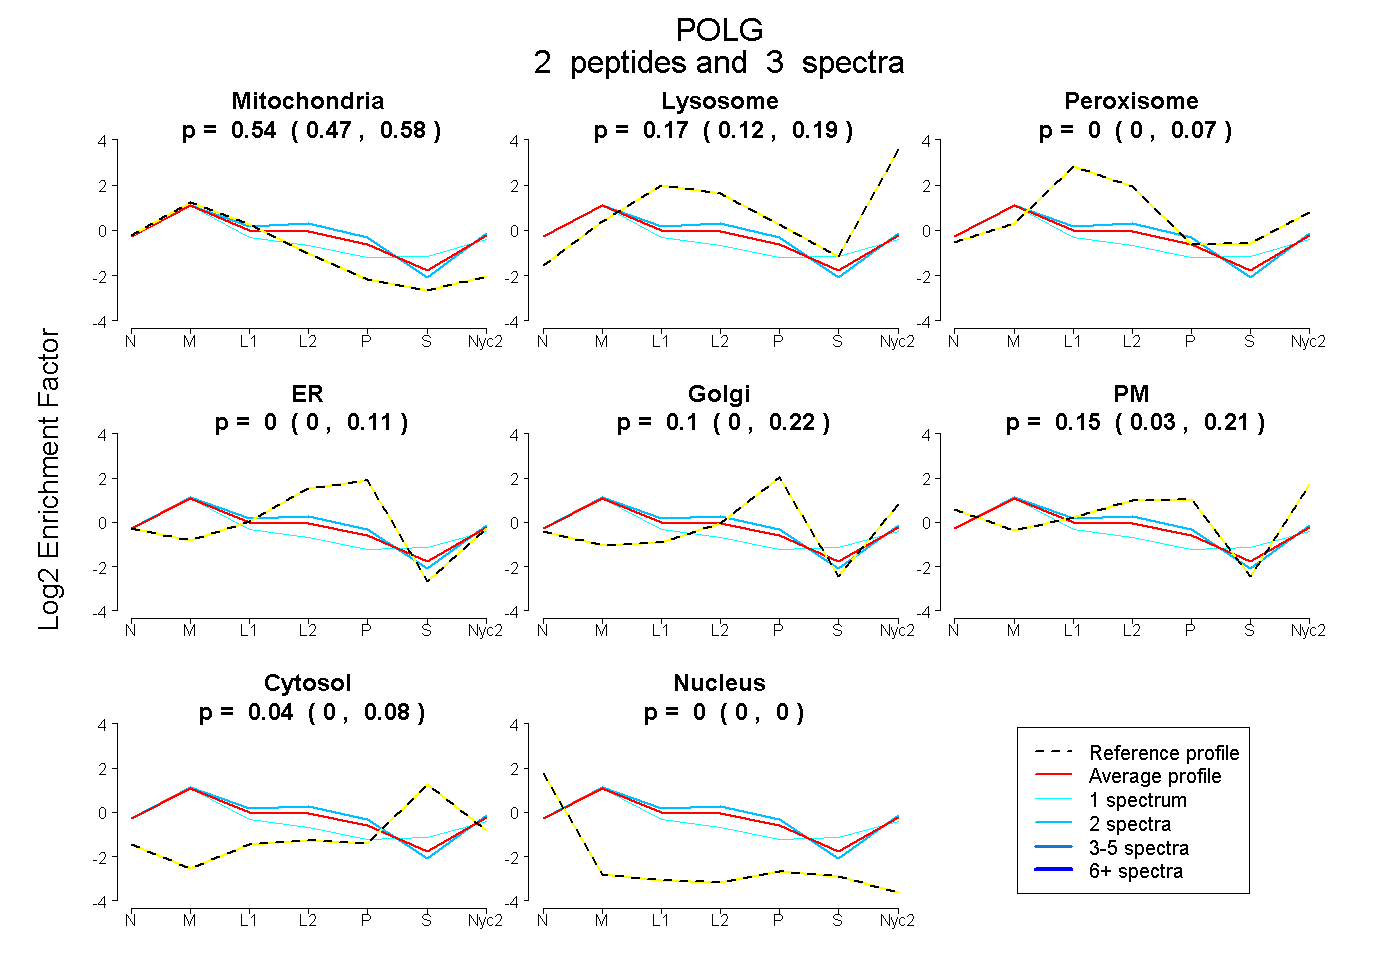
| Expt A |
2 peptides |
3 spectra |
|
0.540 0.466 | 0.580 |
0.171 0.124 | 0.188 |
0.000 0.000 | 0.070 |
0.000 0.000 | 0.108 |
0.103 0.000 | 0.224 |
0.150 0.026 | 0.205 |
0.035 0.000 | 0.083 |
0.000 0.000 | 0.000 |
||
| Plot | Lyso | Other | |||||||||||
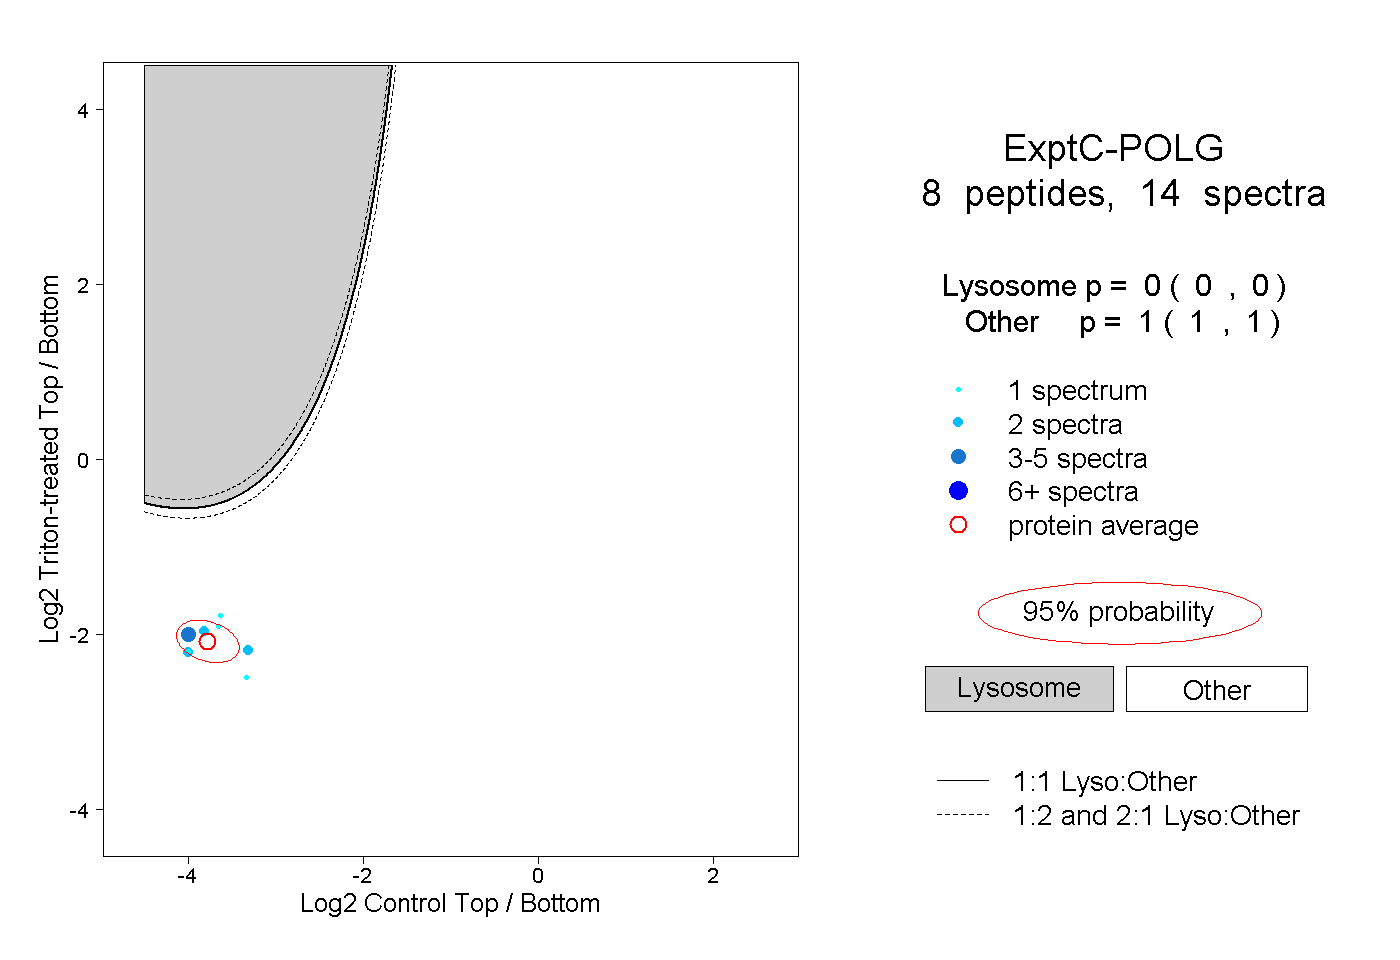
| Expt C |
8 peptides |
14 spectra |
|
0.000 0.000 | 0.000 |
1.000 1.000 | 1.000 |