 2
2peptides
spectra
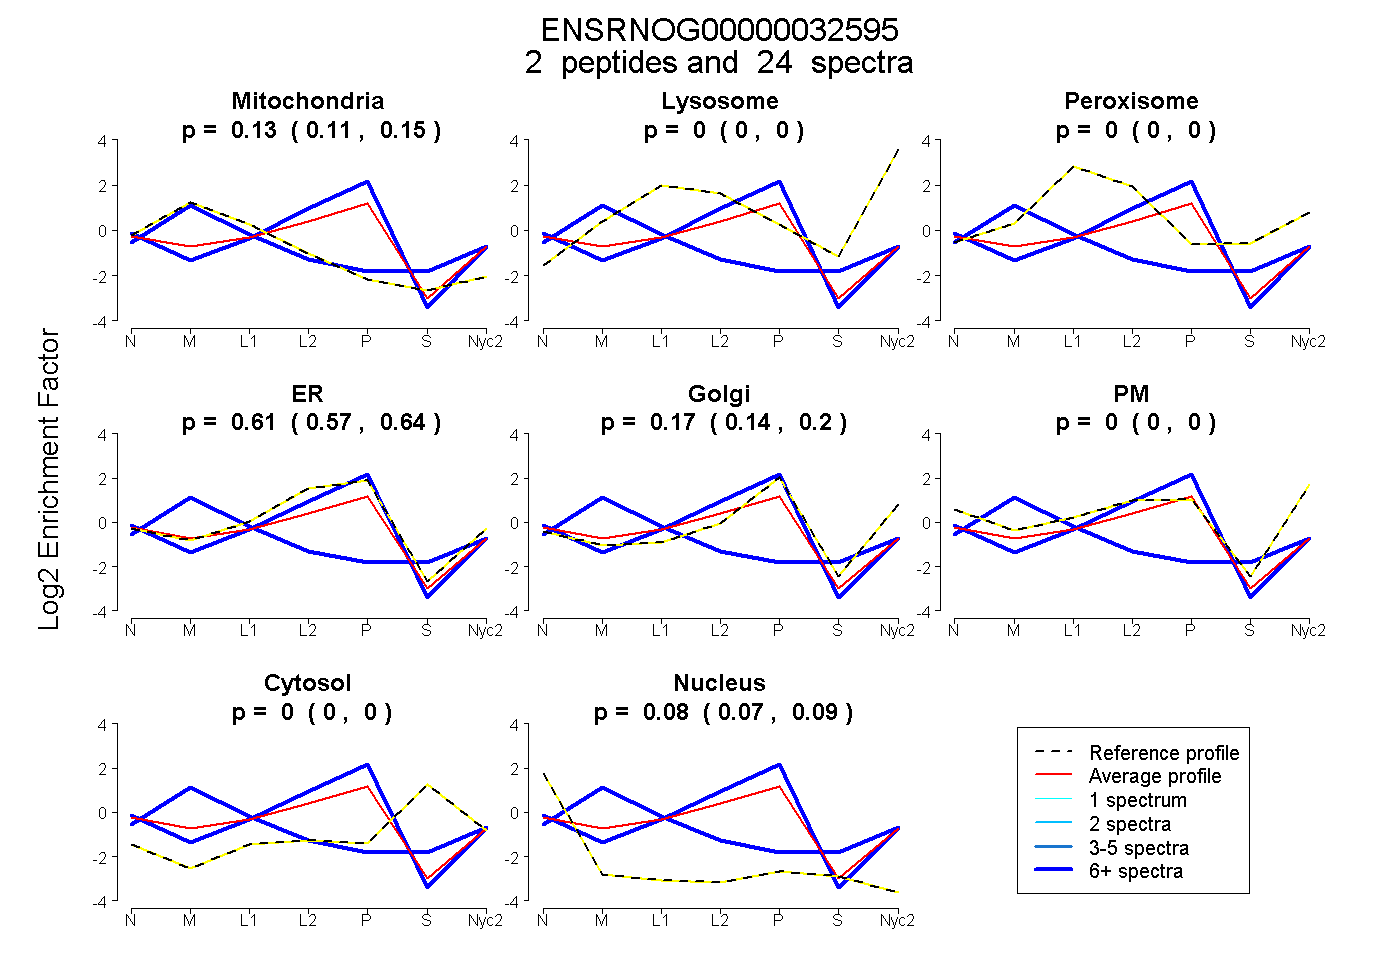
0.105 | 0.149
0.000 | 0.000
0.000 | 0.000
0.575 | 0.645
0.141 | 0.200
0.000 | 0.000
0.000 | 0.000
0.073 | 0.095
1peptide
spectra
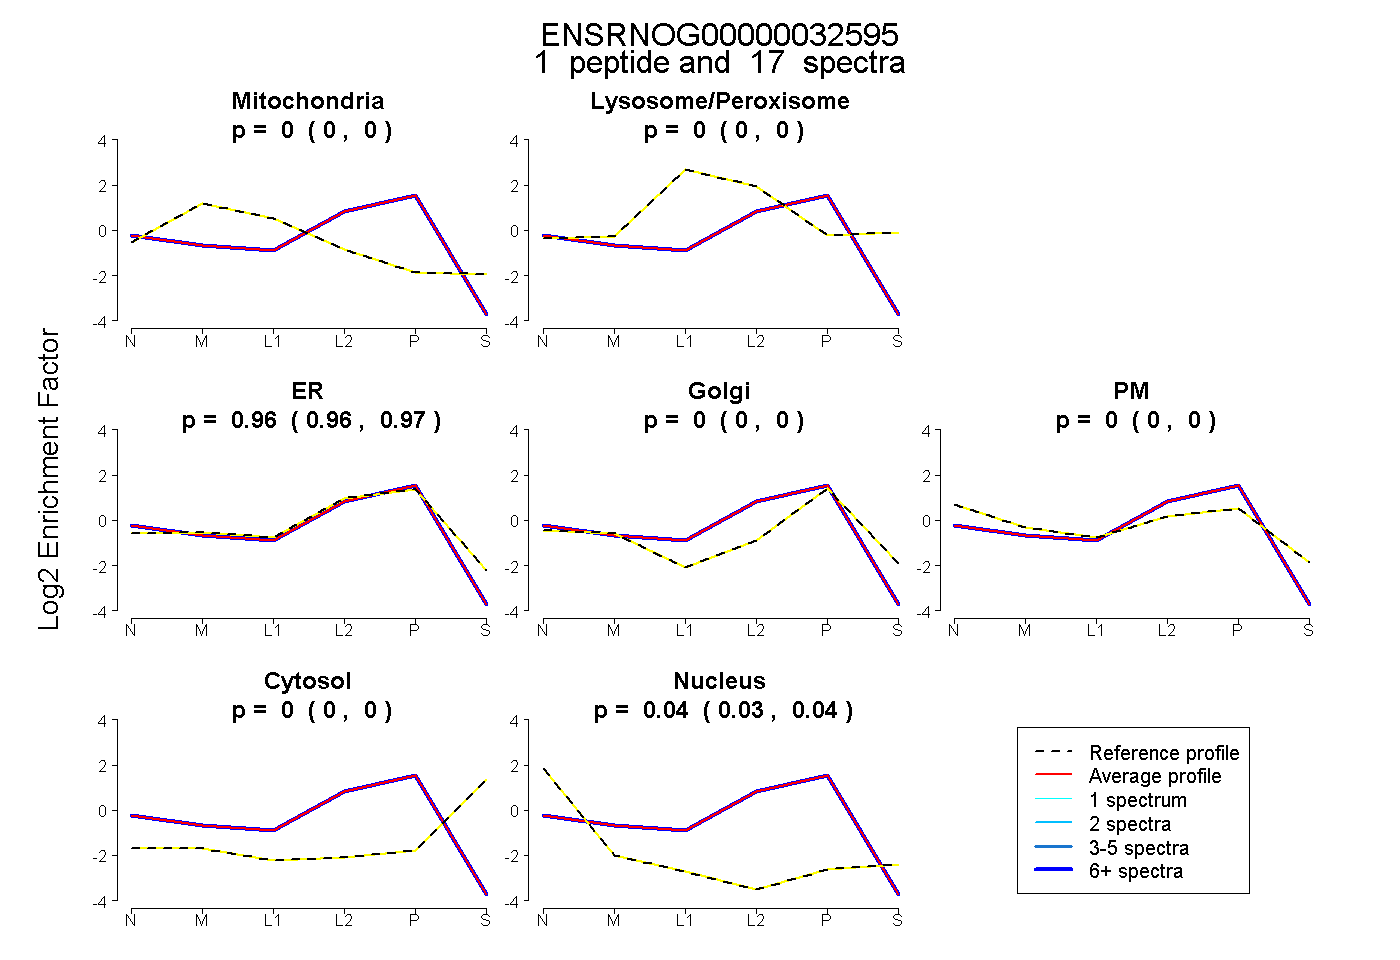
0.000 | 0.000
0.000 | 0.000
0.964 | 0.966
0.000 | 0.000
0.000 | 0.000
0.000 | 0.000
0.034 | 0.036
14peptides
spectra
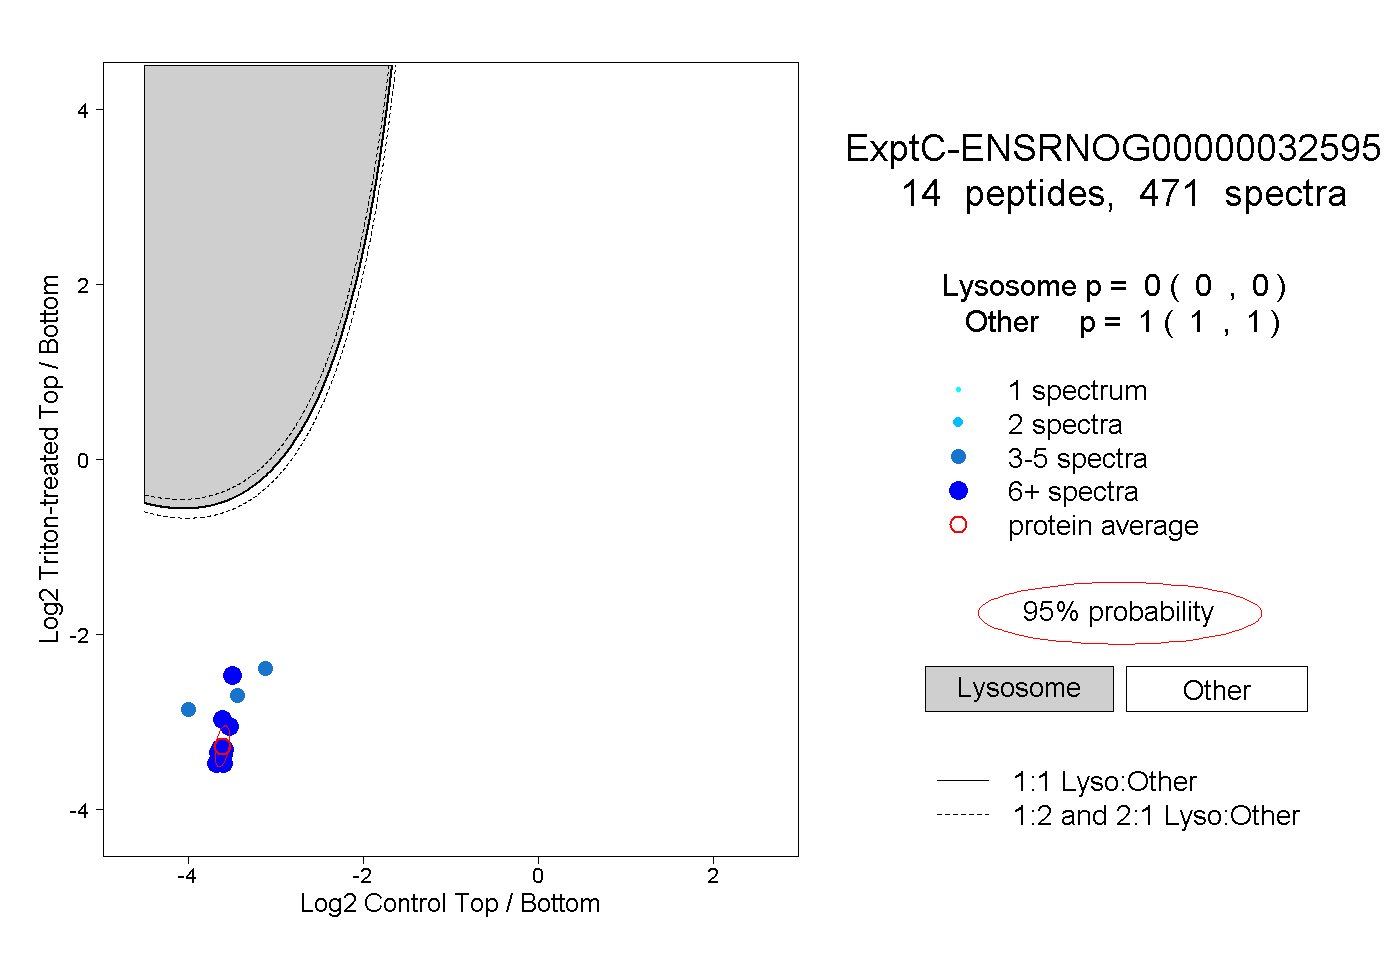
0.000 | 0.000
1.000 | 1.000
1peptide
spectra
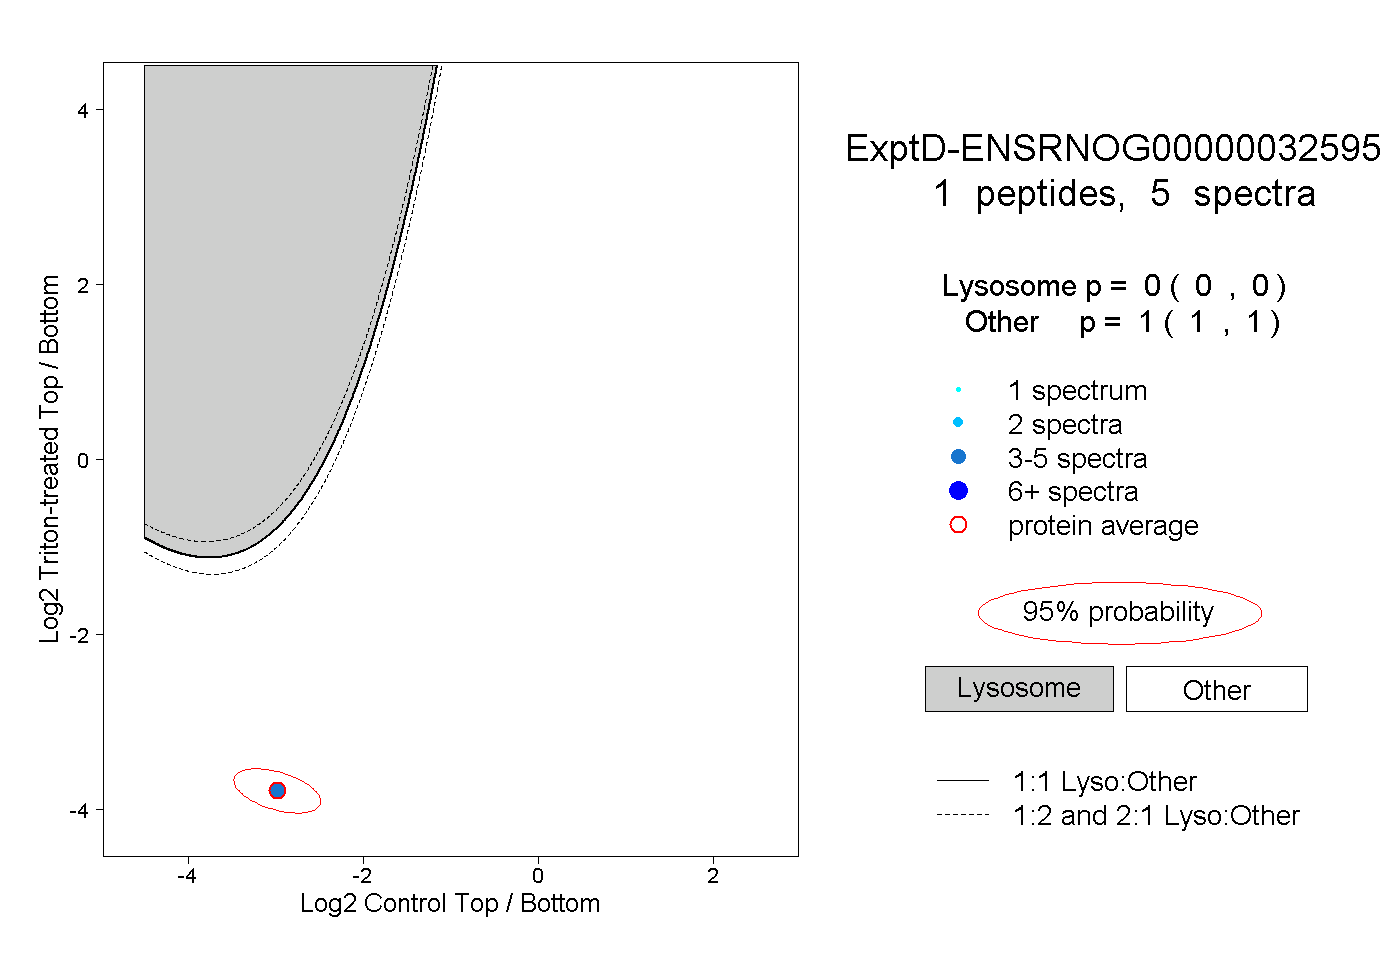
0.000 | 0.000
1.000 | 1.000