 4
4peptides
spectra
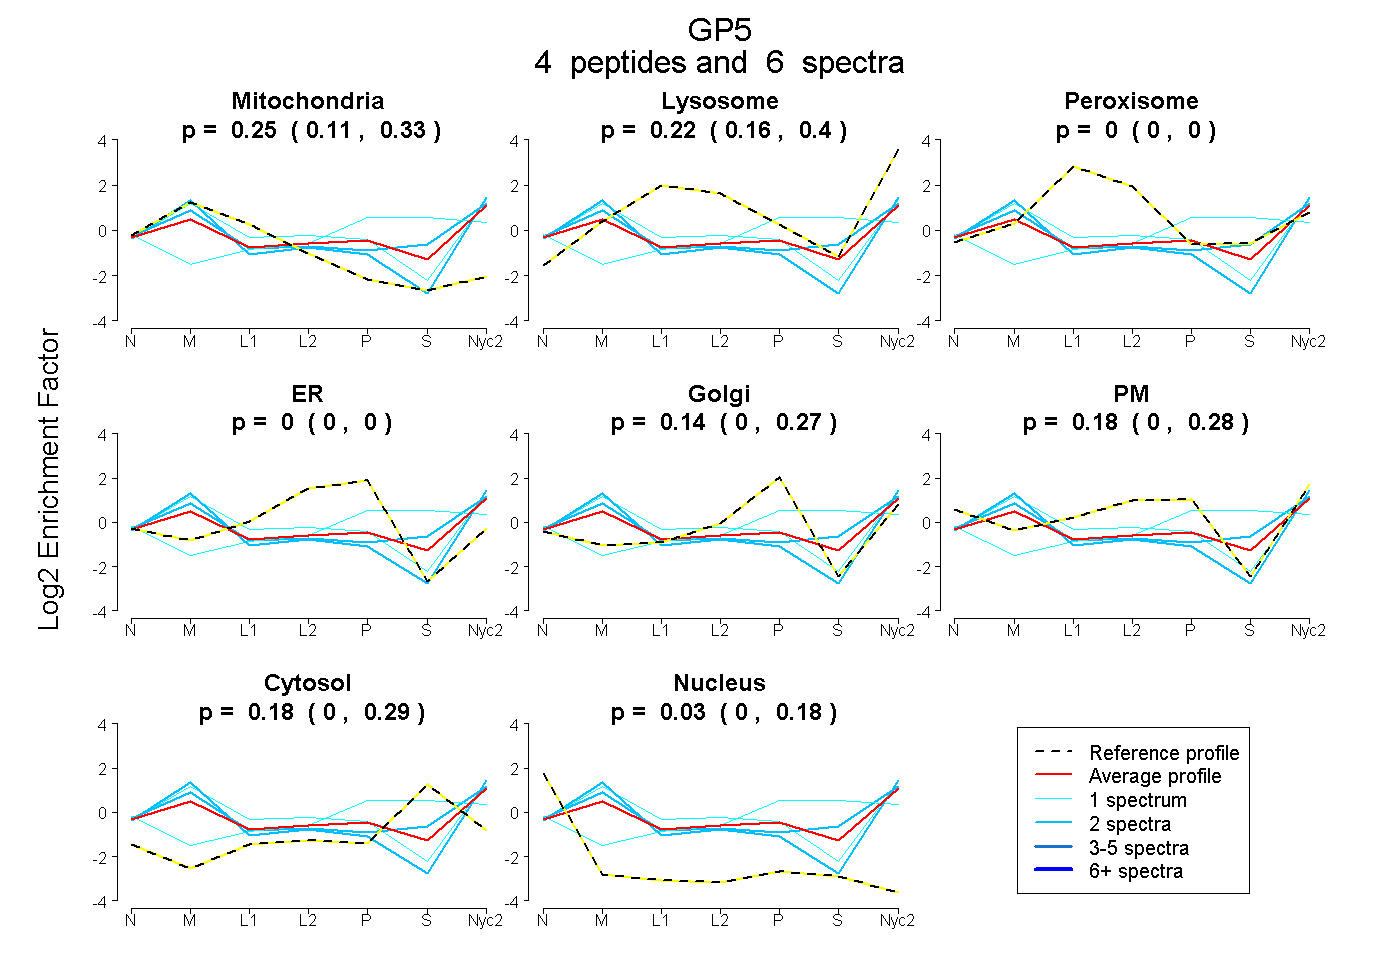
0.109 | 0.335
0.160 | 0.399
0.000 | 0.000
0.000 | 0.000
0.000 | 0.270
0.000 | 0.278
0.003 | 0.288
0.000 | 0.183
| Plot | Mito | Lyso | Perox | ER | Golgi | PM | Cytosol | Nucleus | |||||
| Expt A |
4 peptides |
6 spectra |
|
0.253 0.109 | 0.335 |
0.220 0.160 | 0.399 |
0.000 0.000 | 0.000 |
0.000 0.000 | 0.000 |
0.135 0.000 | 0.270 |
0.184 0.000 | 0.278 |
0.178 0.003 | 0.288 |
0.031 0.000 | 0.183 |
| 1 spectrum, GVLQSHSFSGMTVLQR | 0.381 | 0.273 | 0.000 | 0.000 | 0.145 | 0.201 | 0.000 | 0.000 | ||
| 2 spectra, NPLLSALPR | 0.411 | 0.253 | 0.000 | 0.000 | 0.113 | 0.154 | 0.000 | 0.069 | ||
| 1 spectrum, LGELFR | 0.000 | 0.007 | 0.000 | 0.000 | 0.161 | 0.275 | 0.556 | 0.000 | ||
| 2 spectra, ISHLPR | 0.301 | 0.252 | 0.000 | 0.000 | 0.000 | 0.173 | 0.274 | 0.000 |
| Plot | Lyso | Other | |||||||||||
| Expt C |
3 peptides |
6 spectra |
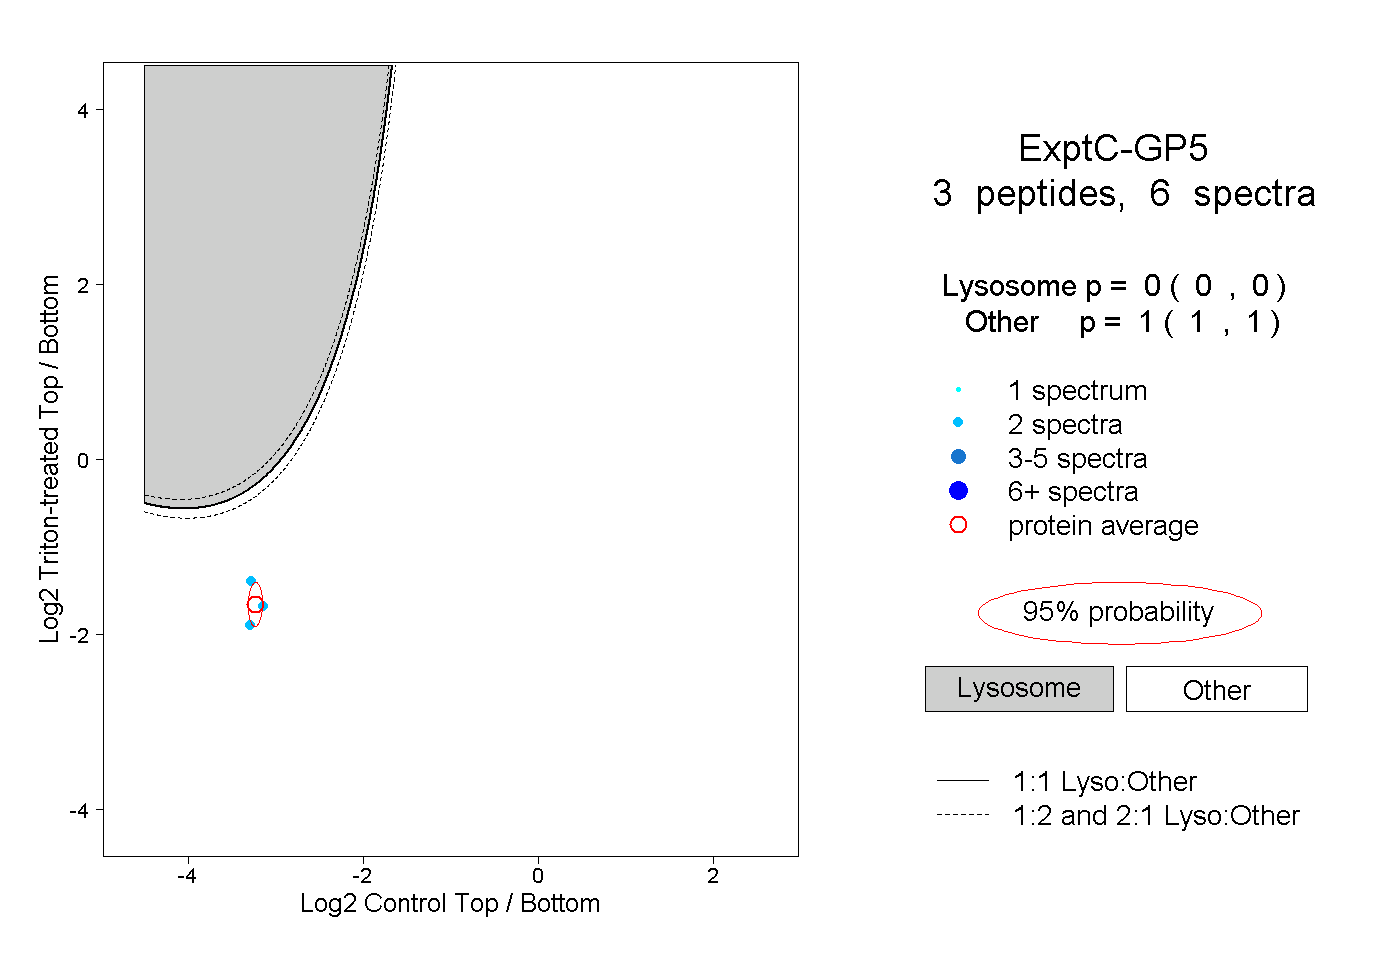 |
0.000 0.000 | 0.000 |
1.000 1.000 | 1.000 |