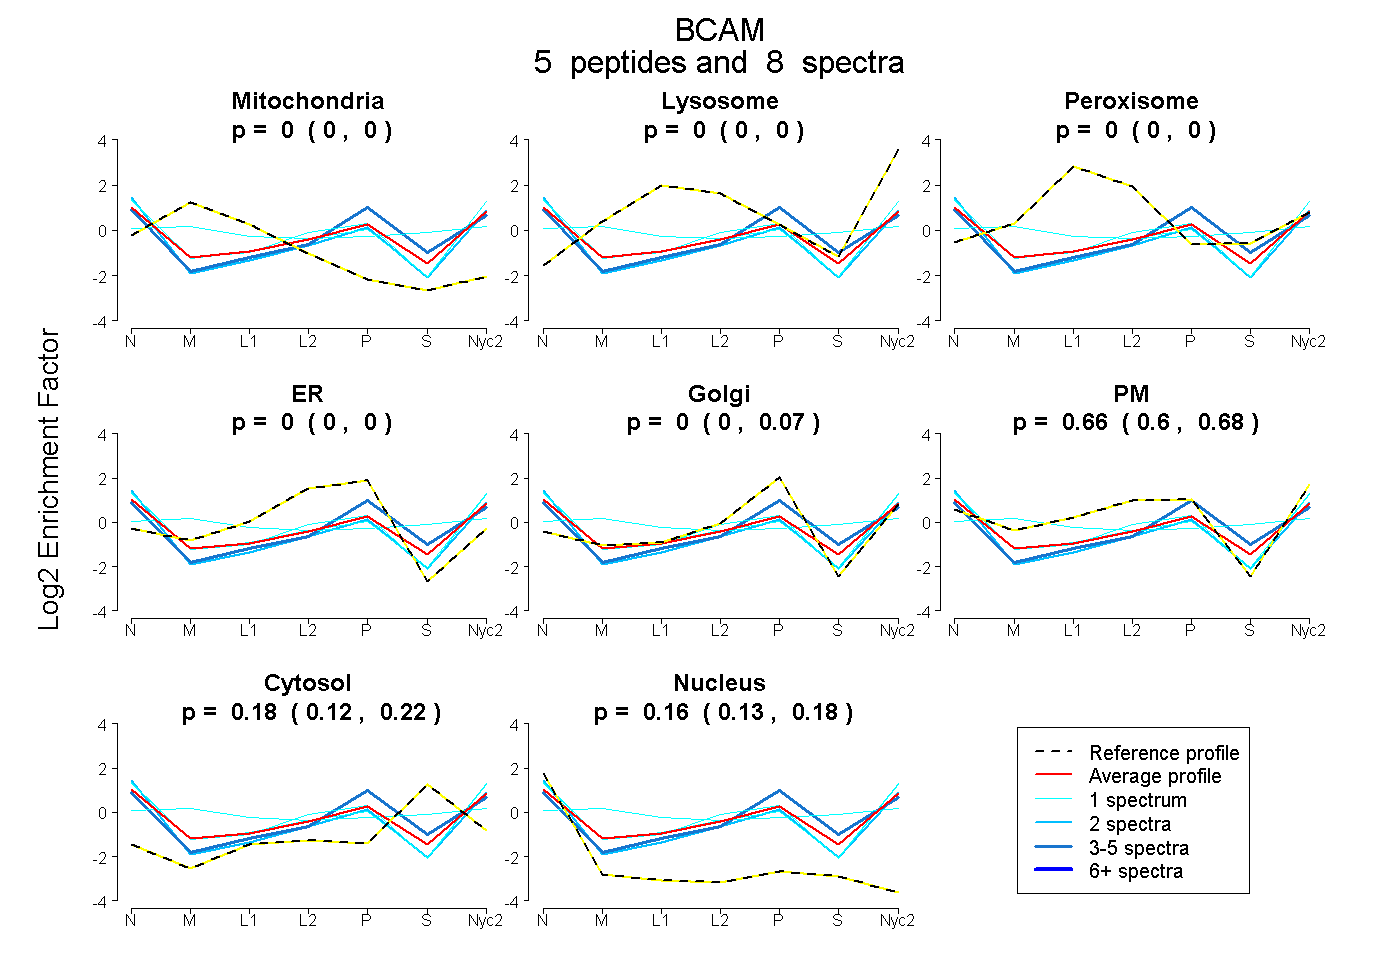
 5
5peptides
spectra
0.000 | 0.000
0.000 | 0.000
0.000 | 0.000
0.000 | 0.000
0.000 | 0.070
0.596 | 0.682
0.123 | 0.223
0.126 | 0.180
| Plot | Mito | Lyso | Perox | ER | Golgi | PM | Cytosol | Nucleus | |||||
| Expt A |
5 peptides |
8 spectra |
|
0.000 0.000 | 0.000 |
0.000 0.000 | 0.000 |
0.000 0.000 | 0.000 |
0.000 0.000 | 0.000 |
0.000 0.000 | 0.070 |
0.663 0.596 | 0.682 |
0.180 0.123 | 0.223 |
0.157 0.126 | 0.180 |
| 3 spectra, GLPAPIVR | 0.000 | 0.000 | 0.000 | 0.000 | 0.374 | 0.295 | 0.232 | 0.099 | ||
| 2 spectra, AGAAGTSEATSSVR | 0.000 | 0.000 | 0.000 | 0.000 | 0.053 | 0.610 | 0.060 | 0.276 | ||
| 1 spectrum, ITWSQR | 0.000 | 0.000 | 0.000 | 0.000 | 0.000 | 0.772 | 0.039 | 0.189 | ||
| 1 spectrum, GWMSSSLTLK | 0.181 | 0.027 | 0.117 | 0.000 | 0.000 | 0.325 | 0.350 | 0.000 | ||
| 1 spectrum, GDTTPAEPPFEGR | 0.000 | 0.000 | 0.000 | 0.000 | 0.000 | 0.738 | 0.057 | 0.205 |
| Plot | Lyso | Other | |||||||||||
| Expt C |
7 peptides |
12 spectra |
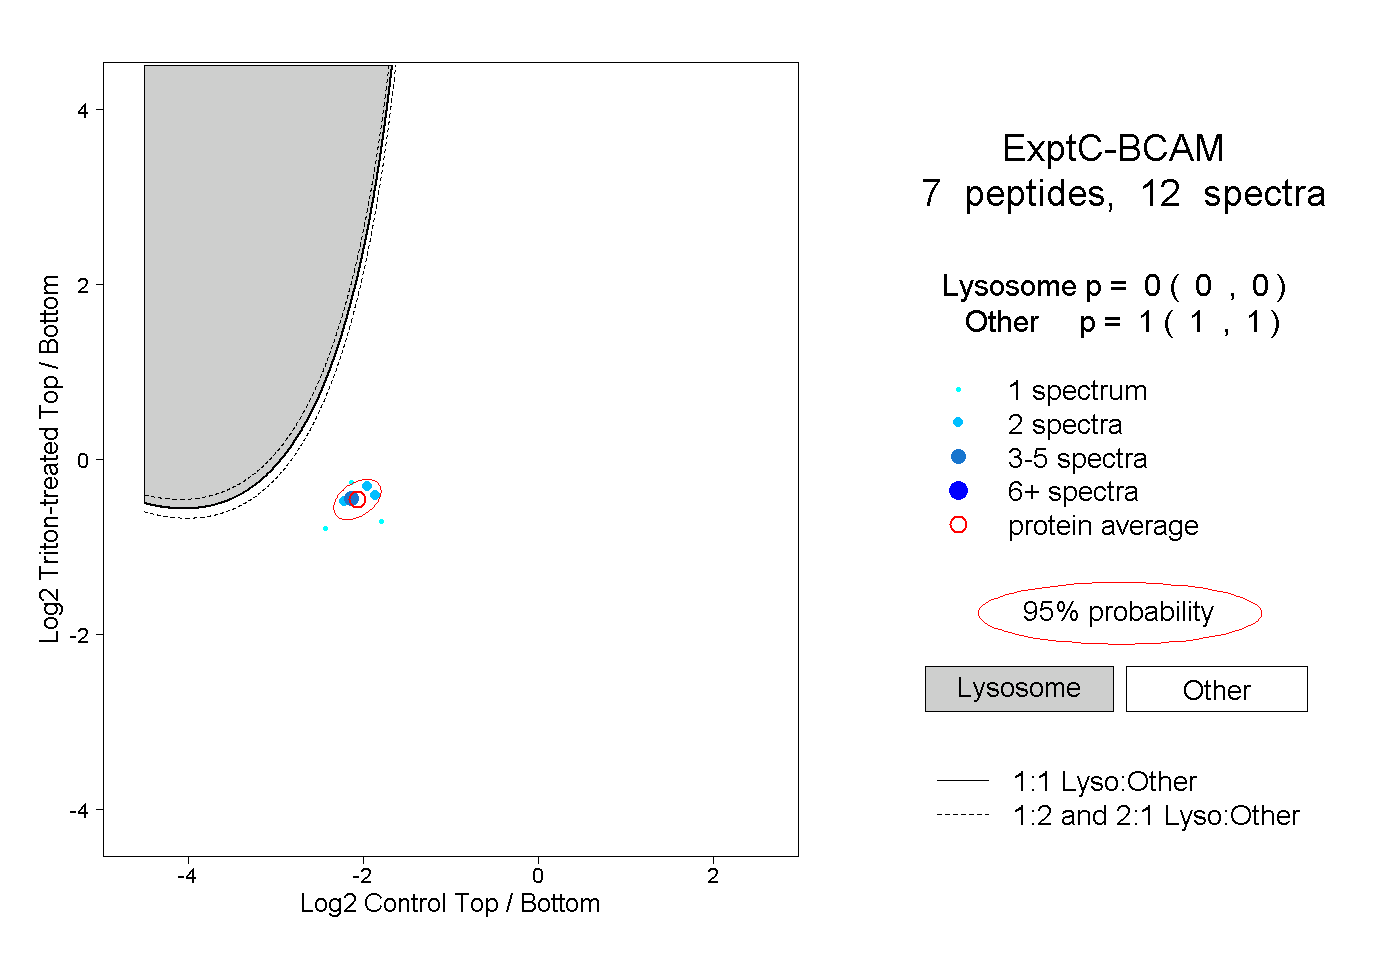 |
0.000 0.000 | 0.000 |
1.000 1.000 | 1.000 |
||||||||
| Plot | Lyso | Other | |||||||||||
| Expt D |
3 peptides |
7 spectra |
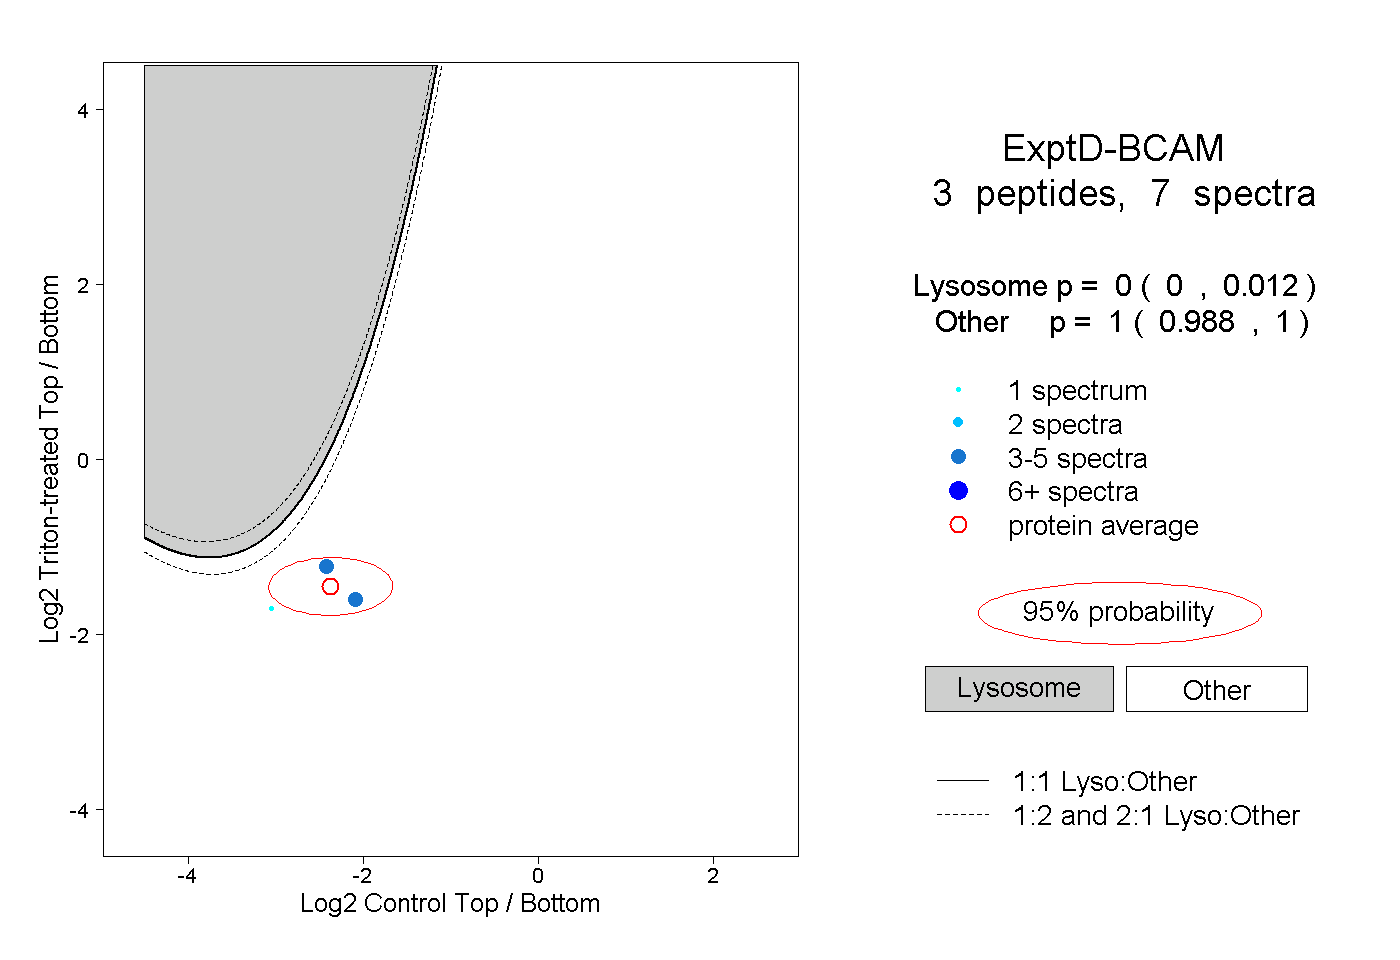 |
0.000 0.000 | 0.012 |
1.000 0.988 | 1.000 |