 3
3peptides
spectra
0.000 | 0.000
0.000 | 0.000
0.000 | 0.000
0.070 | 0.312
0.046 | 0.184
0.205 | 0.388
0.330 | 0.364
0.000 | 0.039
2peptides
spectra
0.000 | 0.000
1.000 | 1.000
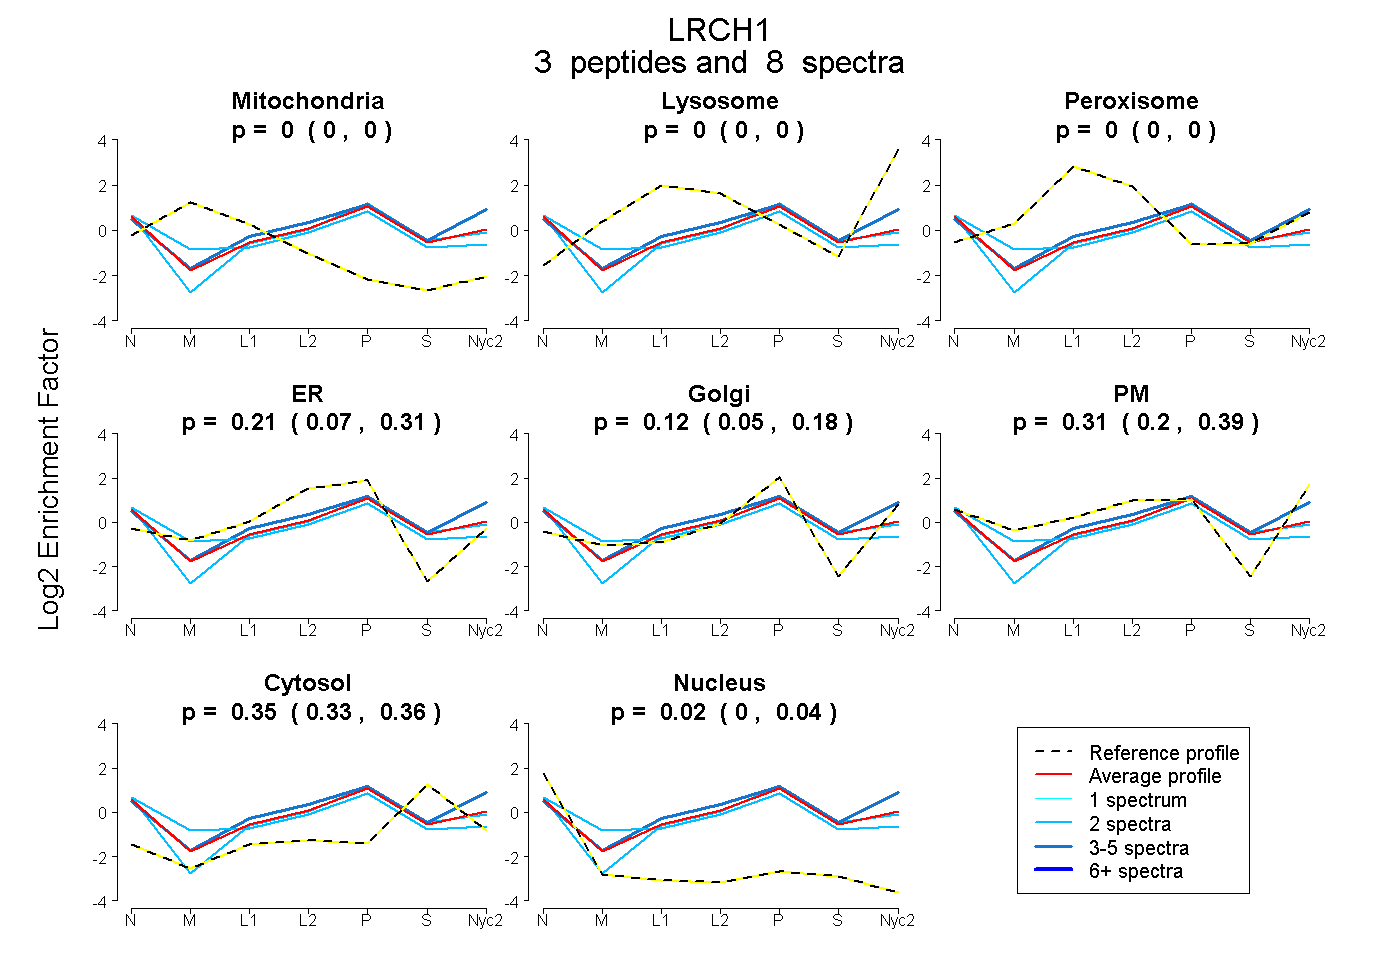
| Plot | Mito | Lyso | Perox | ER | Golgi | PM | Cytosol | Nucleus | |||||
| Expt A |
3 peptides |
8 spectra |
|
0.000 0.000 | 0.000 |
0.000 0.000 | 0.000 |
0.000 0.000 | 0.000 |
0.206 0.070 | 0.312 |
0.118 0.046 | 0.184 |
0.305 0.205 | 0.388 |
0.350 0.330 | 0.364 |
0.021 0.000 | 0.039 |
||
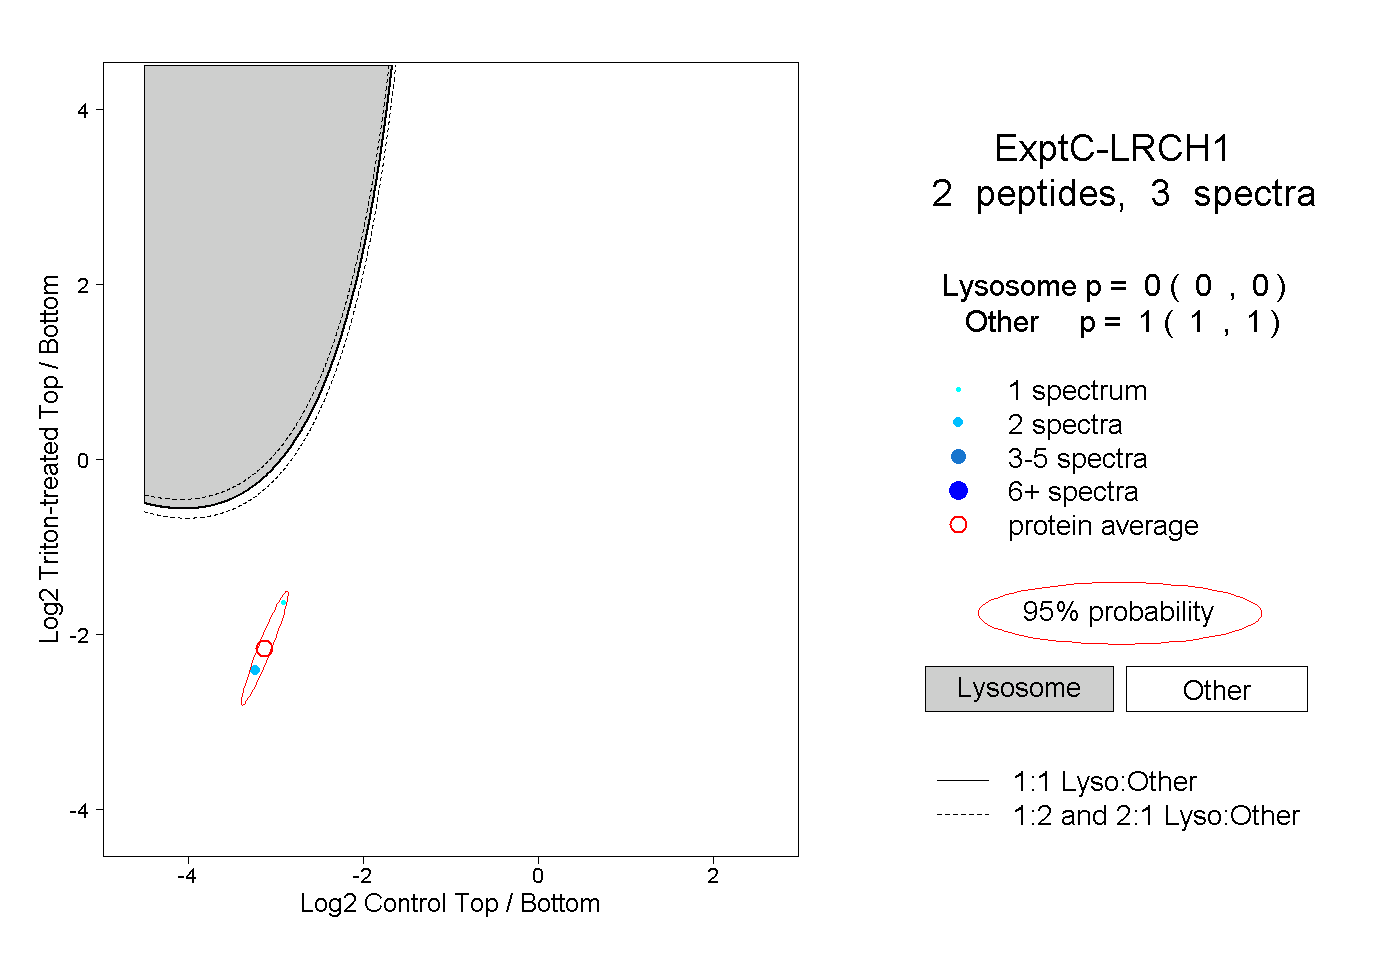
| Plot | Lyso | Other | |||||||||||
| Expt C |
2 peptides |
3 spectra |
|
0.000 0.000 | 0.000 |
1.000 1.000 | 1.000 |