 4
4peptides
spectra
0.000 | 0.000
0.000 | 0.000
0.000 | 0.000
0.000 | 0.000
0.101 | 0.187
0.000 | 0.000
0.223 | 0.268
0.556 | 0.642
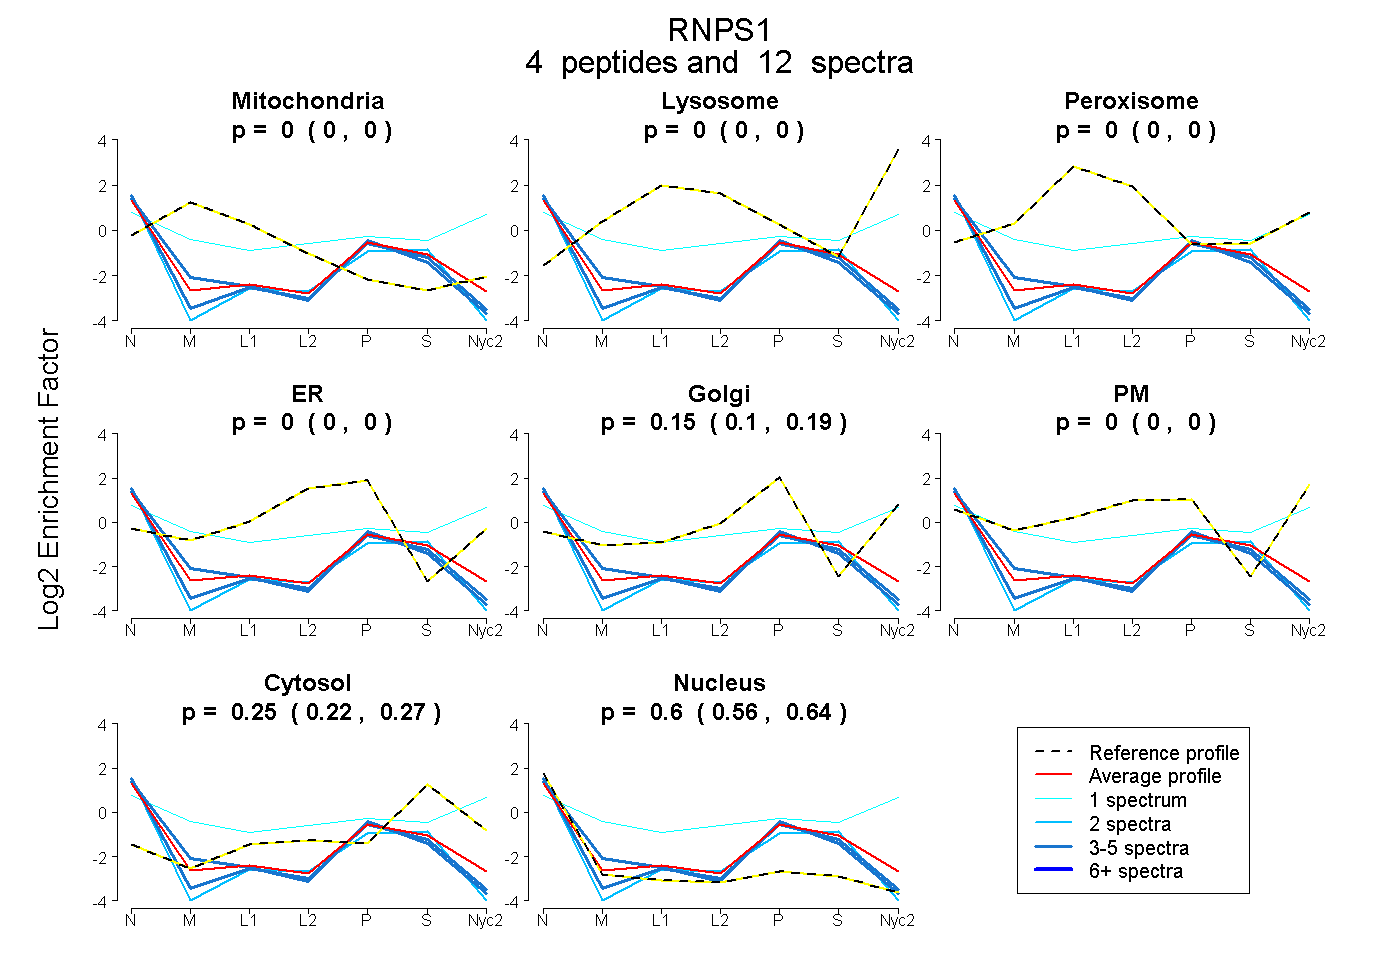
| Plot | Mito | Lyso | Perox | ER | Golgi | PM | Cytosol | Nucleus | |||||
| Expt A |
4 peptides |
12 spectra |
|
0.000 0.000 | 0.000 |
0.000 0.000 | 0.000 |
0.000 0.000 | 0.000 |
0.000 0.000 | 0.000 |
0.150 0.101 | 0.187 |
0.000 0.000 | 0.000 |
0.247 0.223 | 0.268 |
0.603 0.556 | 0.642 |
| 2 spectra, GYAYVEFENPDEAEK | 0.000 | 0.000 | 0.000 | 0.000 | 0.000 | 0.000 | 0.273 | 0.727 | ||
| 4 spectra, MIDMPVER | 0.000 | 0.000 | 0.000 | 0.000 | 0.146 | 0.000 | 0.136 | 0.718 | ||
| 1 spectrum, DHIMEIFSTYGK | 0.062 | 0.000 | 0.000 | 0.000 | 0.000 | 0.532 | 0.353 | 0.052 | ||
| 5 spectra, MLPPPPMWR | 0.000 | 0.000 | 0.000 | 0.000 | 0.064 | 0.000 | 0.217 | 0.719 |