 3
3peptides
spectra
0.000 | 0.000
0.000 | 0.000
0.000 | 0.000
0.506 | 0.718
0.102 | 0.333
0.000 | 0.000
0.000 | 0.149
0.034 | 0.128
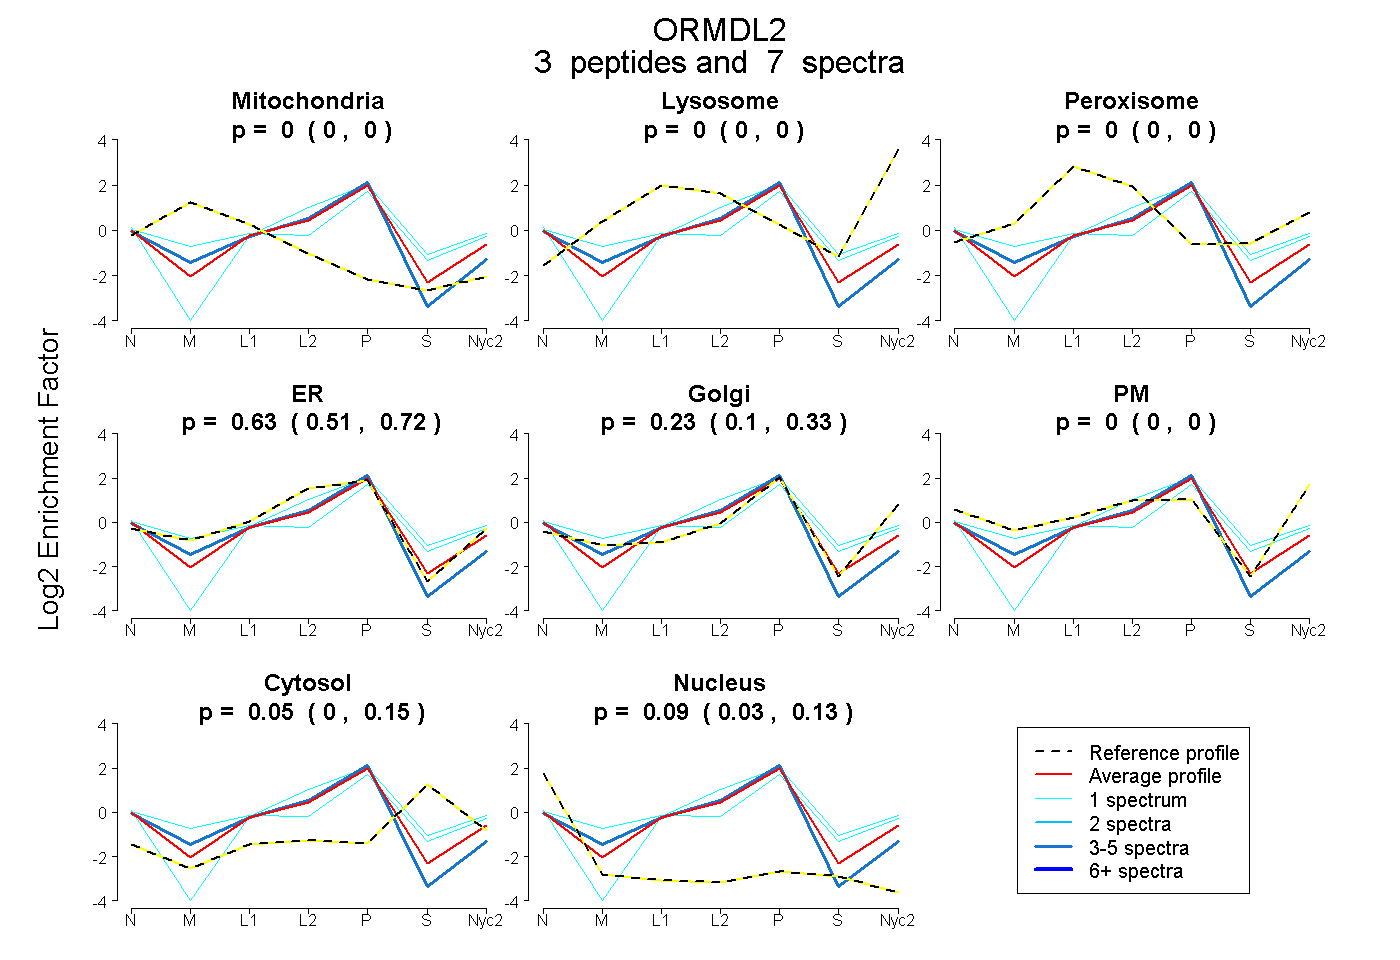
| Plot | Mito | Lyso | Perox | ER | Golgi | PM | Cytosol | Nucleus | |||||
| Expt A |
3 peptides |
7 spectra |
|
0.000 0.000 | 0.000 |
0.000 0.000 | 0.000 |
0.000 0.000 | 0.000 |
0.626 0.506 | 0.718 |
0.235 0.102 | 0.333 |
0.000 0.000 | 0.000 |
0.049 0.000 | 0.149 |
0.090 0.034 | 0.128 |
| 5 spectra, LPQFHGVR | 0.000 | 0.000 | 0.000 | 0.859 | 0.000 | 0.000 | 0.000 | 0.141 | ||
| 1 spectrum, IFGINK | 0.044 | 0.000 | 0.078 | 0.225 | 0.504 | 0.000 | 0.133 | 0.016 | ||
| 1 spectrum, GTPFETPDQGK | 0.000 | 0.000 | 0.000 | 0.613 | 0.092 | 0.000 | 0.296 | 0.000 |
| Plot | Mito | Lyso or Perox | ER | Golgi | PM | Cytosol | Nucleus | ||||||
| Expt B |
1 peptide |
2 spectra |
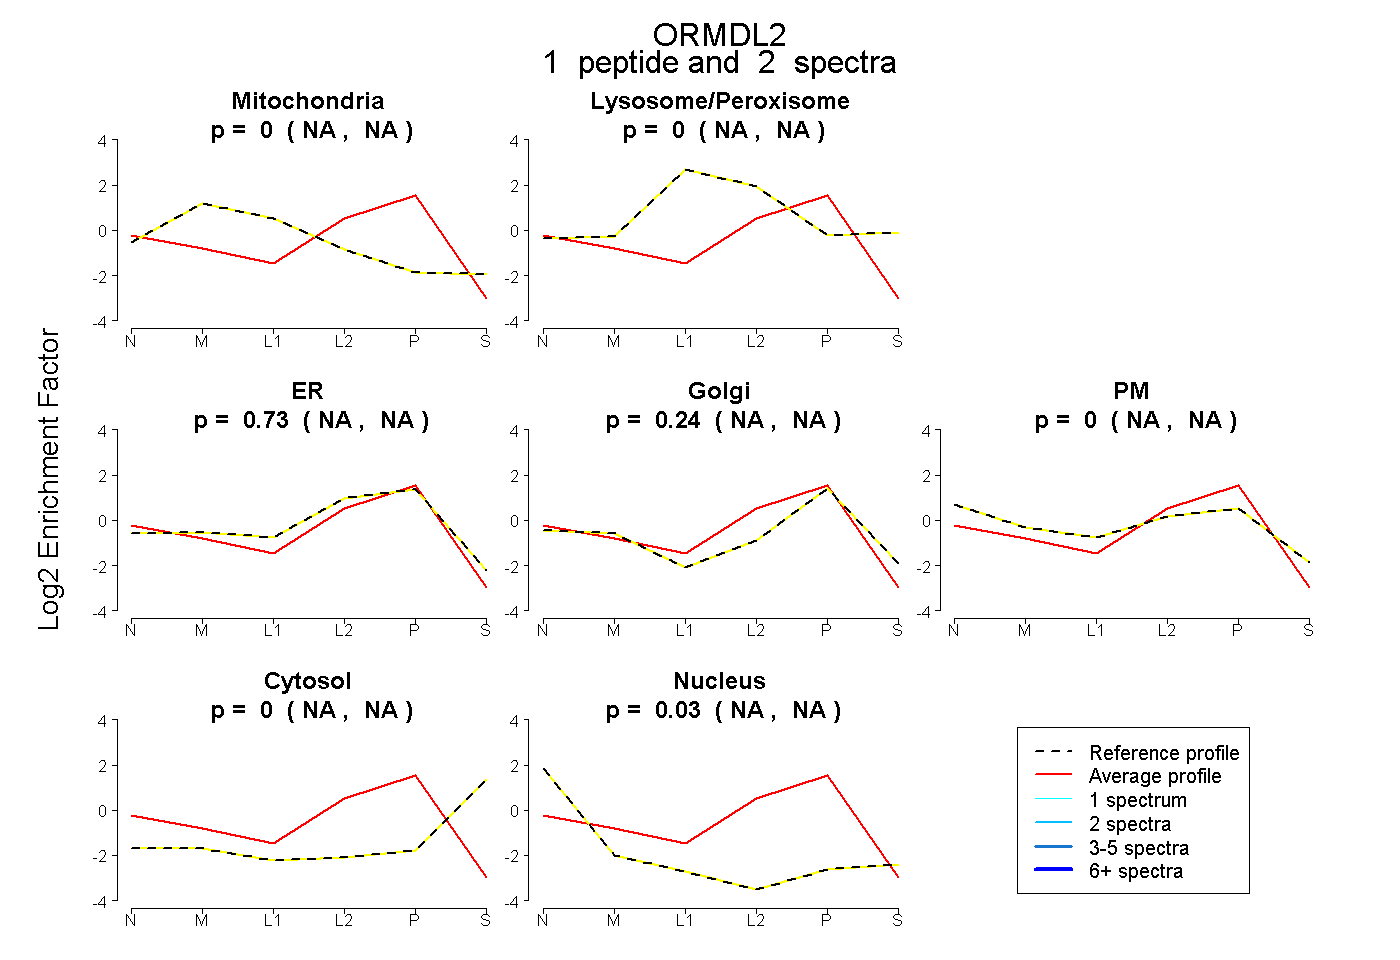 |
0.000 NA | NA |
0.000 NA | NA |
0.734 NA | NA |
0.237 NA | NA |
0.000 NA | NA |
0.000 NA | NA |
0.029 NA | NA |
|||
| Plot | Lyso | Other | |||||||||||
| Expt C |
2 peptides |
3 spectra |
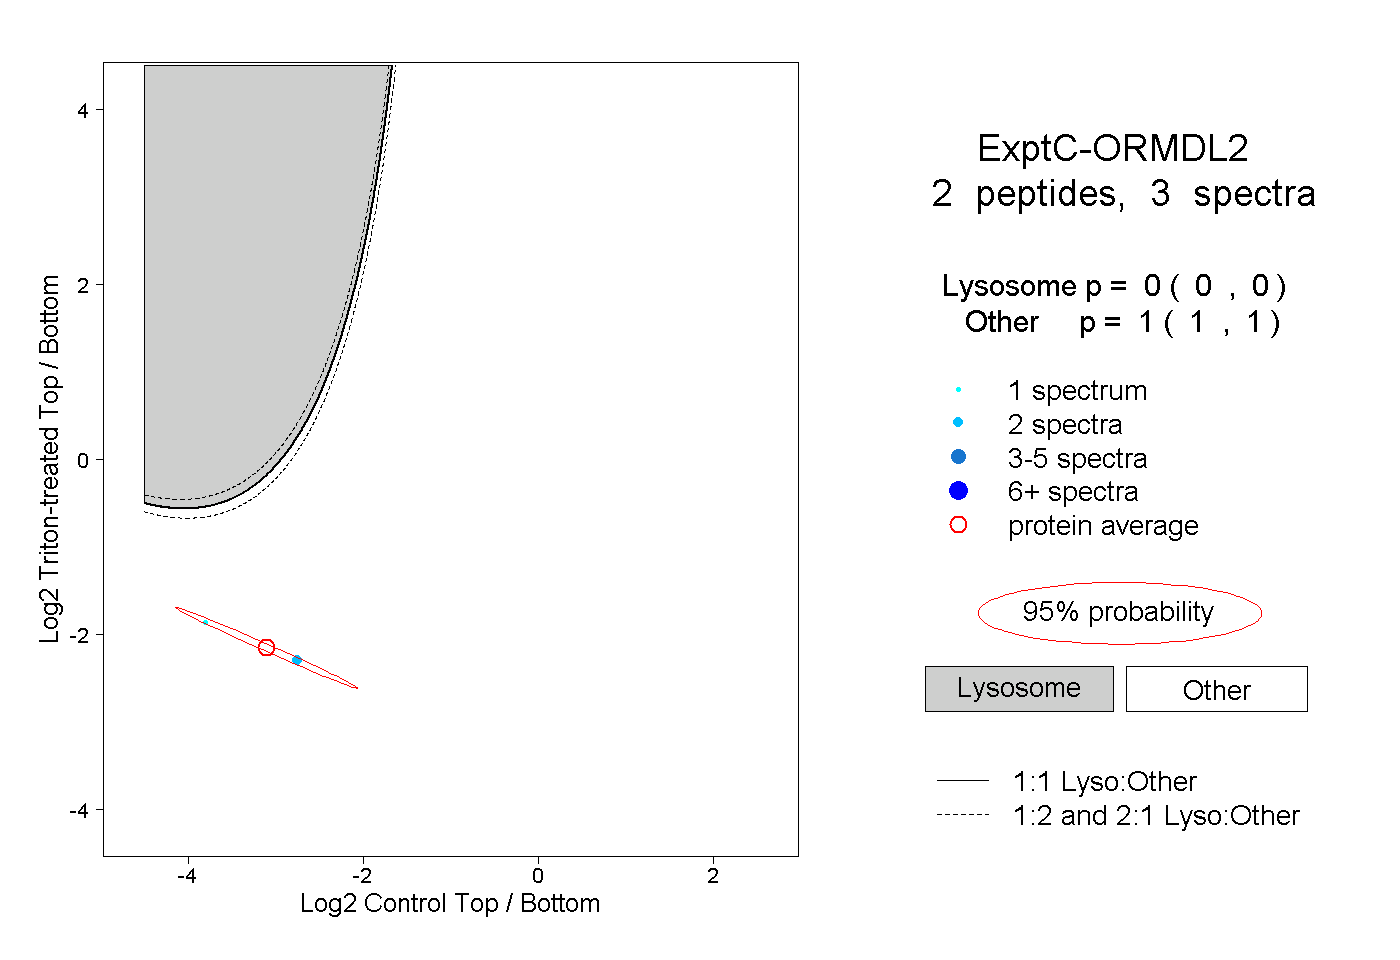 |
0.000 0.000 | 0.000 |
1.000 1.000 | 1.000 |
||||||||
| Plot | Lyso | Other | |||||||||||
| Expt D |
1 peptide |
2 spectra |
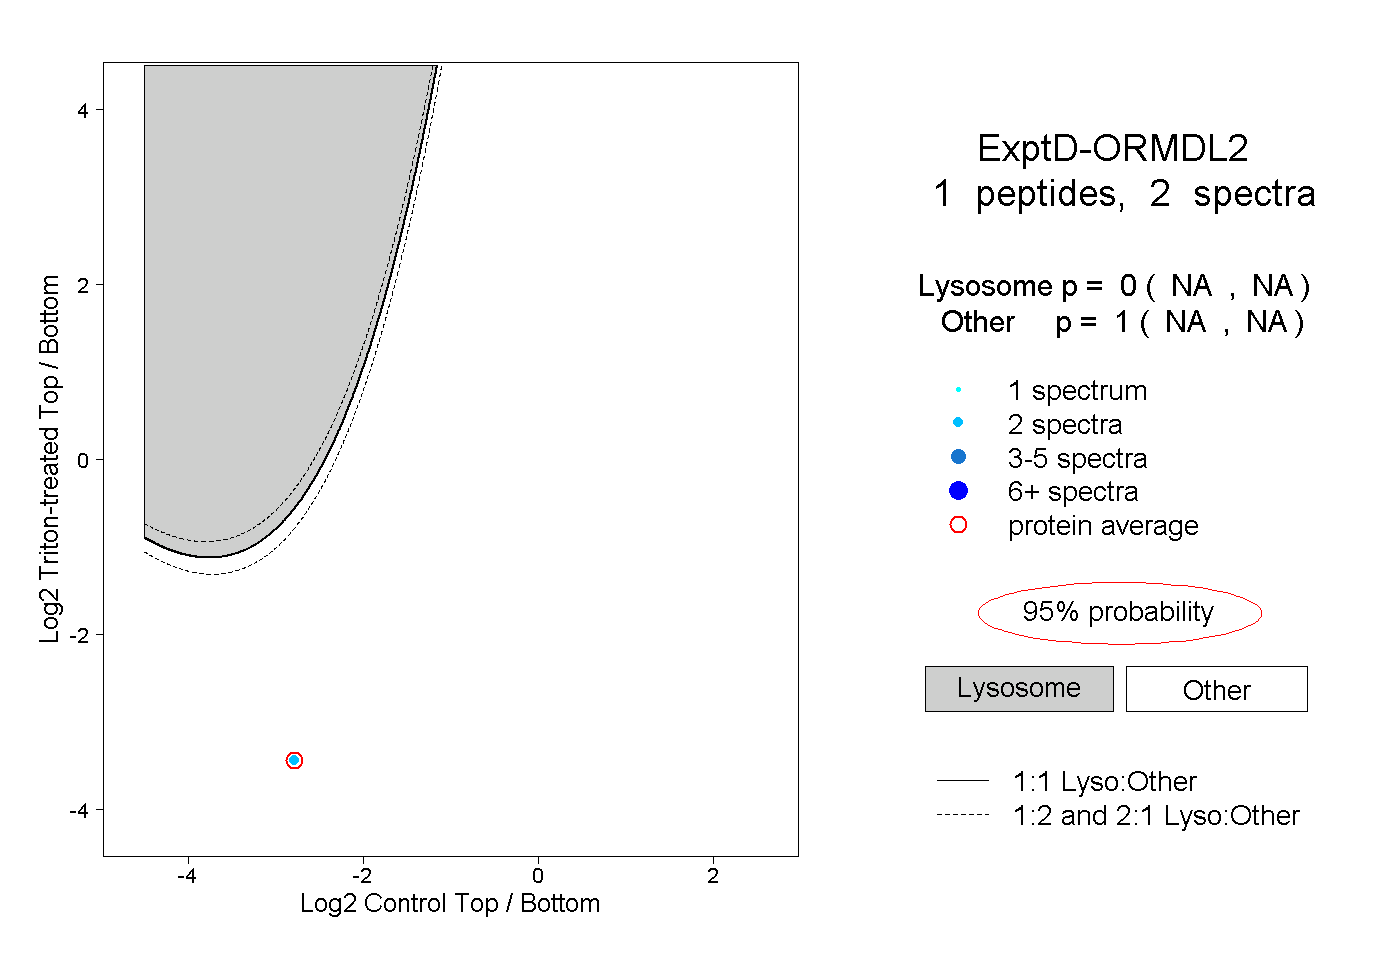 |
0.000 NA | NA |
1.000 NA | NA |