12
12peptides
spectra
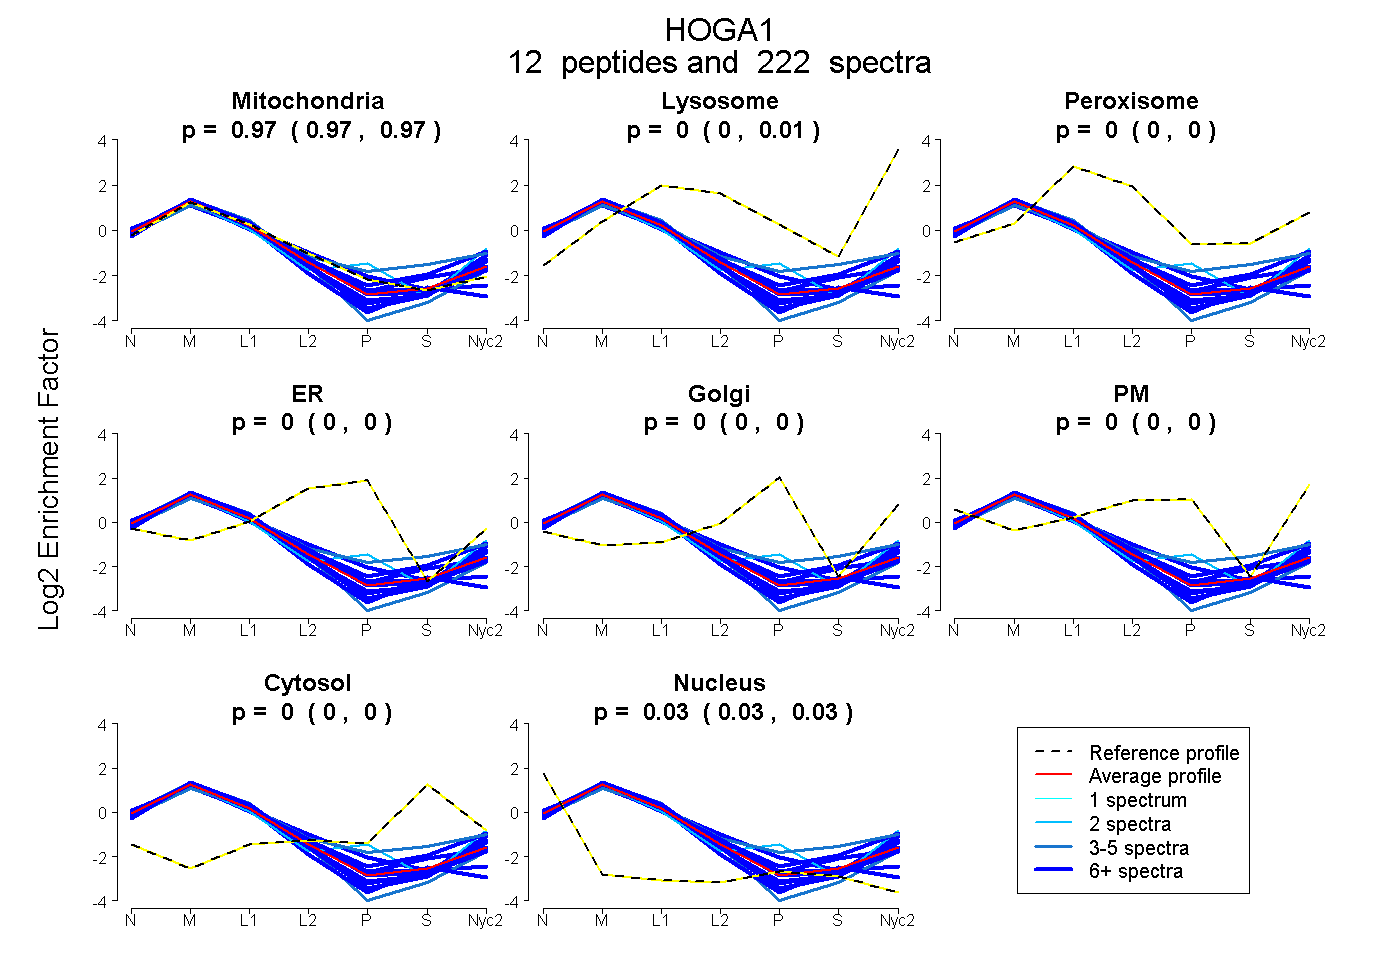
0.966 | 0.972
0.000 | 0.005
0.000 | 0.000
0.000 | 0.000
0.000 | 0.000
0.000 | 0.000
0.000 | 0.000
0.027 | 0.029
11peptides
spectra
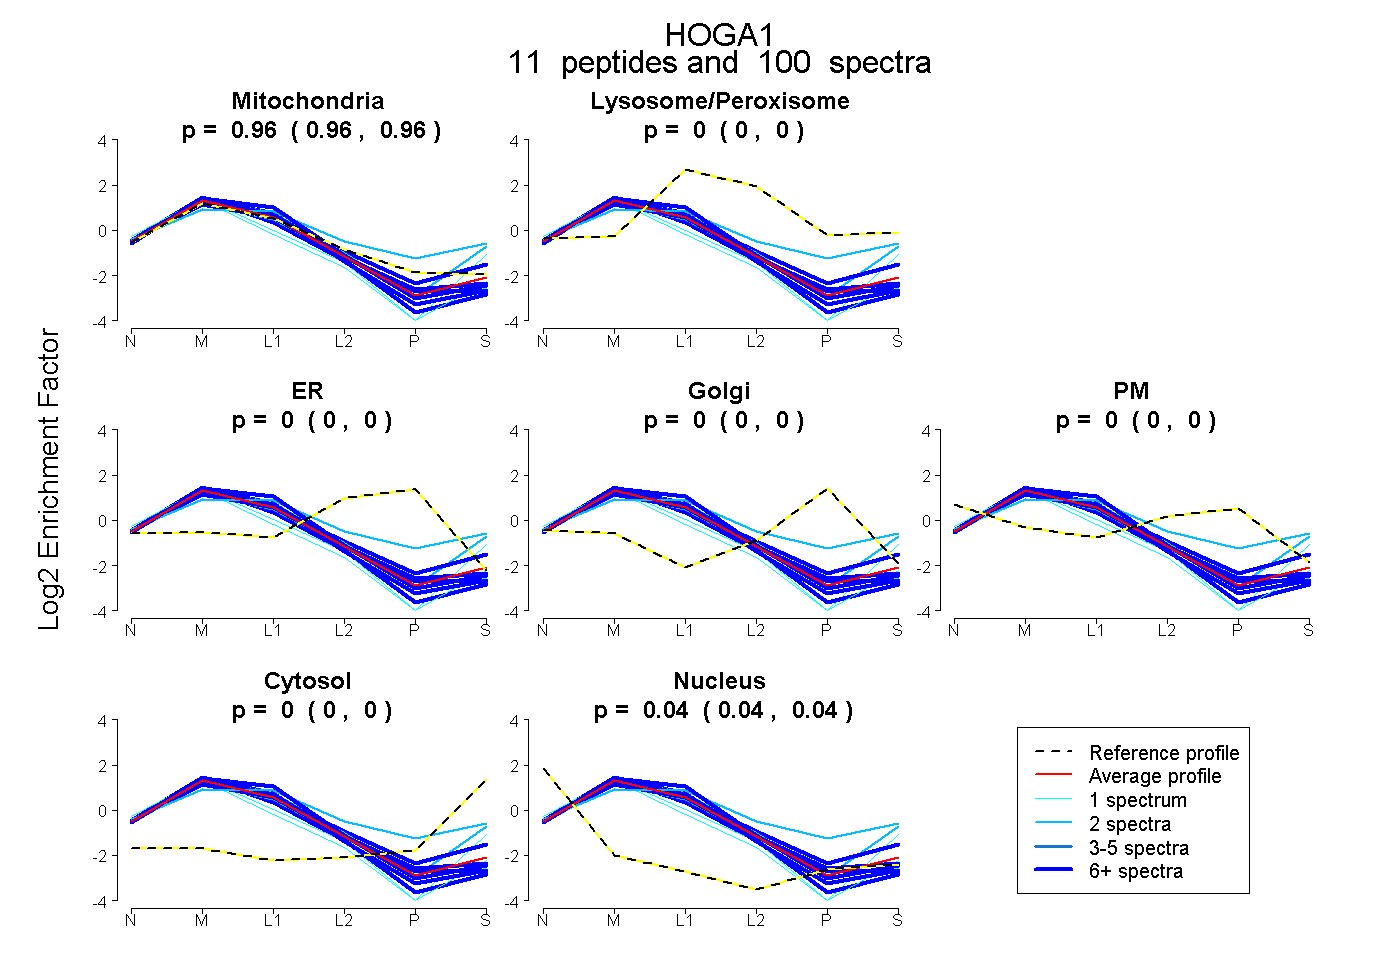
0.959 | 0.963
0.000 | 0.000
0.000 | 0.000
0.000 | 0.000
0.000 | 0.000
0.000 | 0.000
0.036 | 0.041
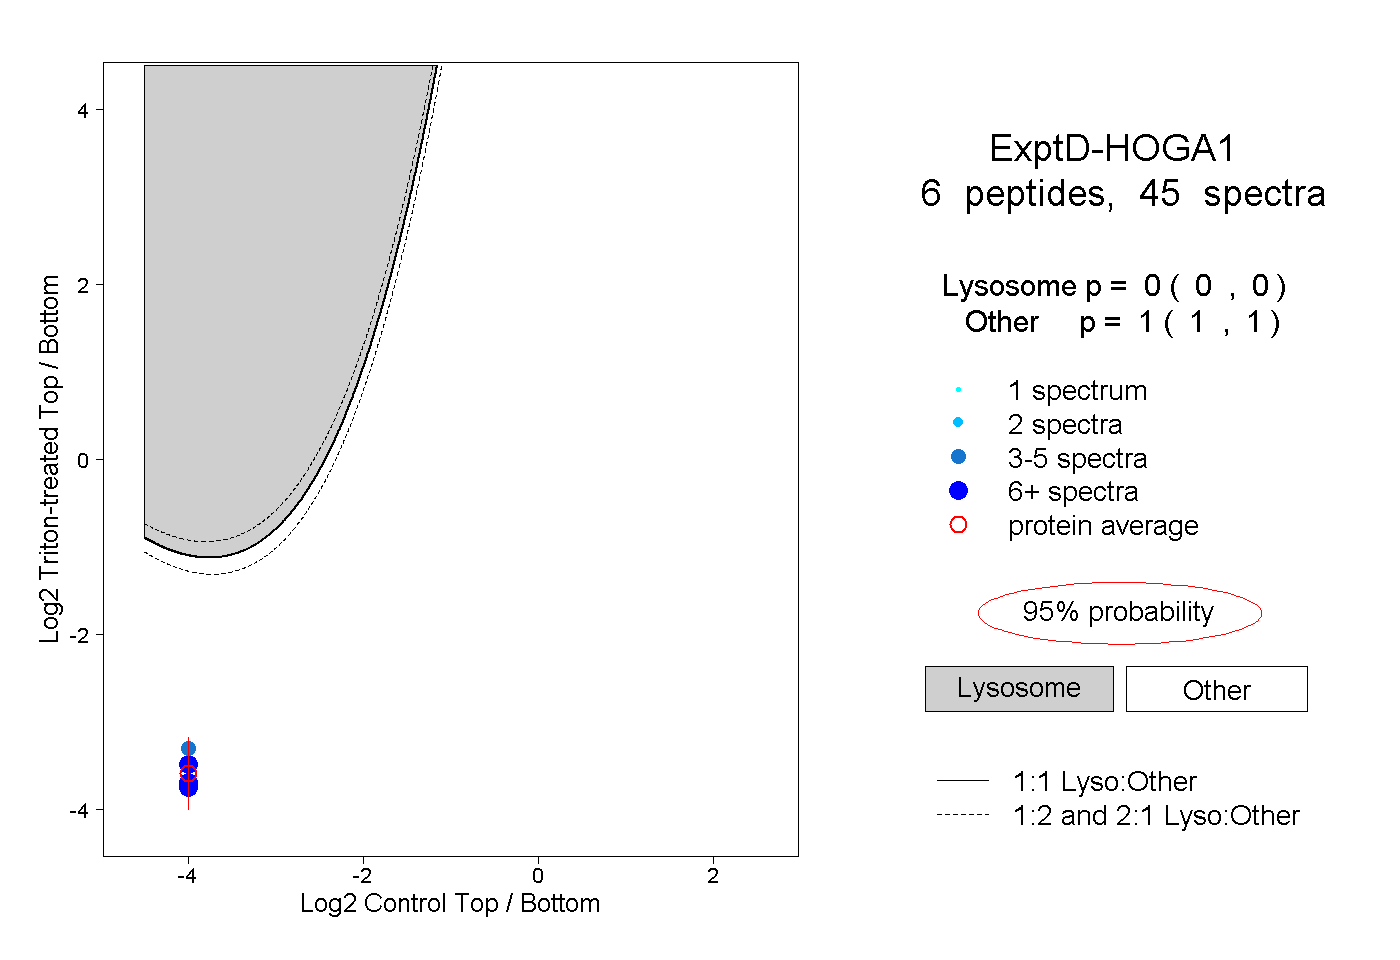
12peptides
spectra
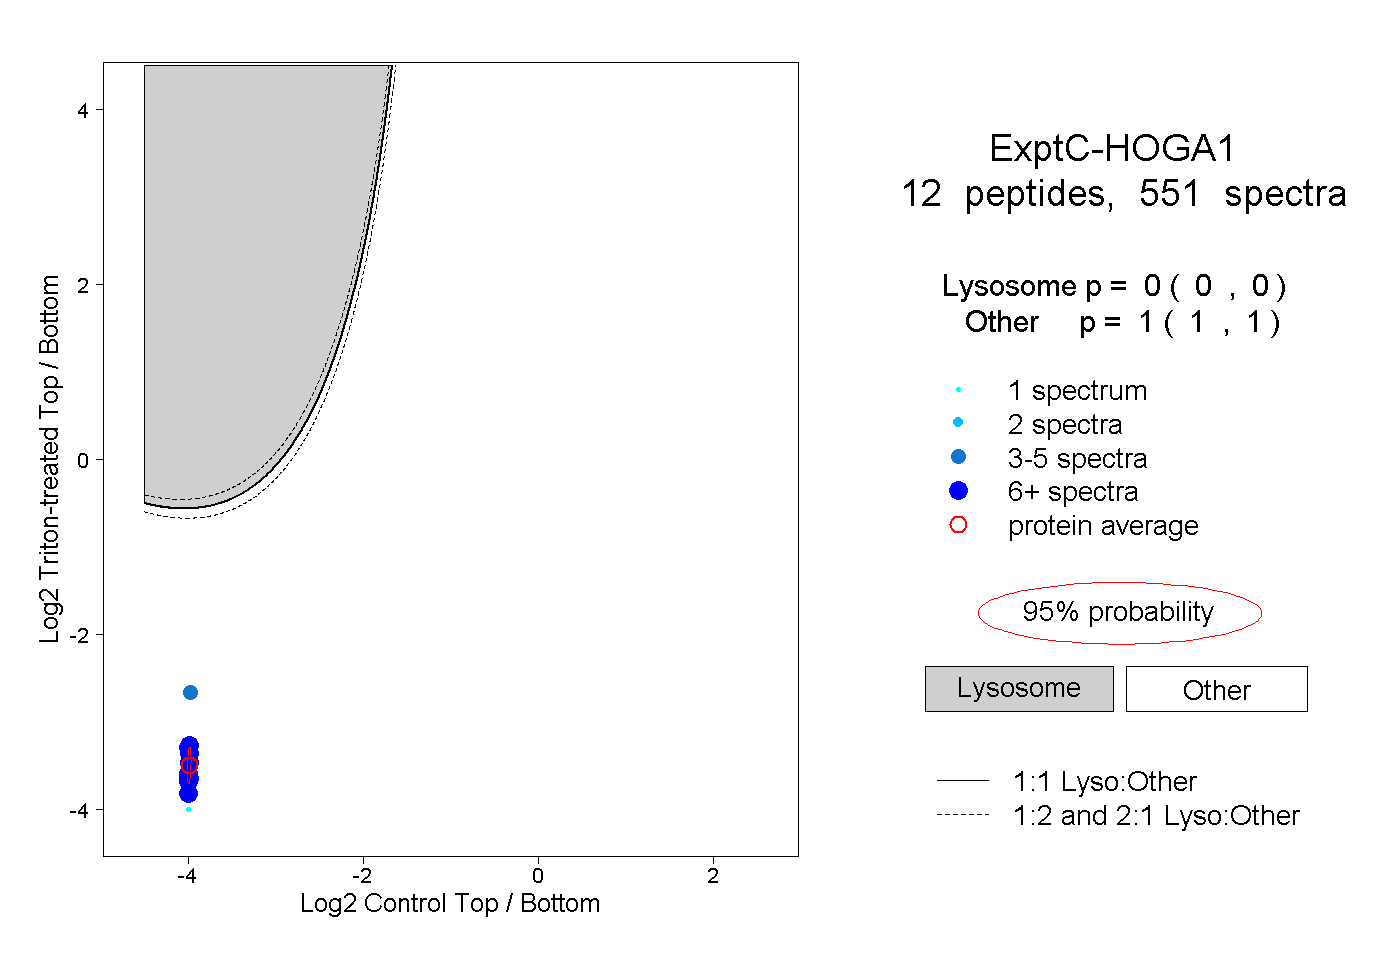
0.000 | 0.000
1.000 | 1.000