 12
12peptides
spectra
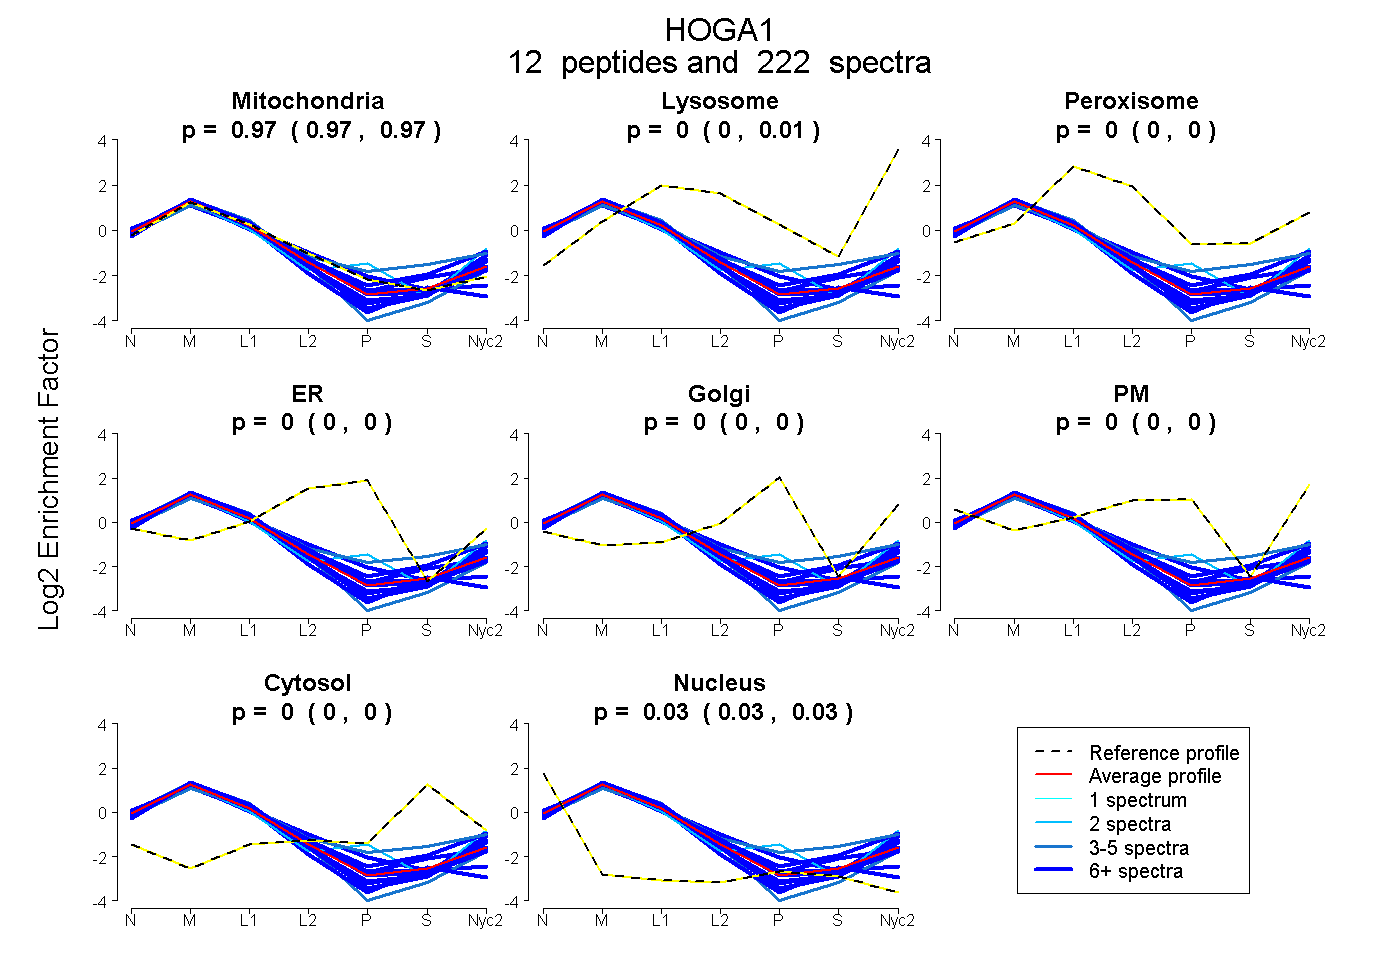
0.966 | 0.972
0.000 | 0.005
0.000 | 0.000
0.000 | 0.000
0.000 | 0.000
0.000 | 0.000
0.000 | 0.000
0.027 | 0.029
| Plot | Mito | Lyso | Perox | ER | Golgi | PM | Cytosol | Nucleus | |||||
| Expt A |
12 peptides |
222 spectra |
|
0.970 0.966 | 0.972 |
0.003 0.000 | 0.005 |
0.000 0.000 | 0.000 |
0.000 0.000 | 0.000 |
0.000 0.000 | 0.000 |
0.000 0.000 | 0.000 |
0.000 0.000 | 0.000 |
0.028 0.027 | 0.029 |
| 8 spectra, FGIPGLK | 0.923 | 0.000 | 0.000 | 0.000 | 0.000 | 0.000 | 0.077 | 0.000 | ||
| 5 spectra, MNSAALIHHYTK | 0.753 | 0.117 | 0.000 | 0.000 | 0.000 | 0.000 | 0.130 | 0.000 | ||
| 15 spectra, TMDWFGYYGGPCR | 0.990 | 0.000 | 0.000 | 0.000 | 0.000 | 0.000 | 0.000 | 0.010 | ||
| 36 spectra, LAAFPFR | 0.961 | 0.003 | 0.000 | 0.000 | 0.000 | 0.000 | 0.000 | 0.036 | ||
| 27 spectra, LEVVSR | 0.836 | 0.089 | 0.000 | 0.000 | 0.000 | 0.000 | 0.068 | 0.006 | ||
| 9 spectra, APLQELSPSEEEALR | 0.934 | 0.000 | 0.000 | 0.011 | 0.000 | 0.000 | 0.000 | 0.055 | ||
| 9 spectra, DSGGDVTR | 0.900 | 0.057 | 0.000 | 0.000 | 0.000 | 0.000 | 0.000 | 0.043 | ||
| 2 spectra, LDFSNNGWL | 0.793 | 0.000 | 0.000 | 0.000 | 0.103 | 0.085 | 0.000 | 0.019 | ||
| 51 spectra, LIEPNTAVTR | 0.968 | 0.000 | 0.000 | 0.000 | 0.000 | 0.000 | 0.000 | 0.032 | ||
| 17 spectra, TGLIVHK | 0.970 | 0.013 | 0.000 | 0.000 | 0.000 | 0.000 | 0.000 | 0.017 | ||
| 38 spectra, LCLTGQGEAAQR | 0.888 | 0.000 | 0.000 | 0.000 | 0.000 | 0.000 | 0.000 | 0.112 | ||
| 5 spectra, GFVVQGSTGEFPFLTSLER | 0.968 | 0.000 | 0.000 | 0.000 | 0.000 | 0.000 | 0.000 | 0.032 |
| Plot | Mito | Lyso or Perox | ER | Golgi | PM | Cytosol | Nucleus | ||||||
| Expt B |
11 peptides |
100 spectra |
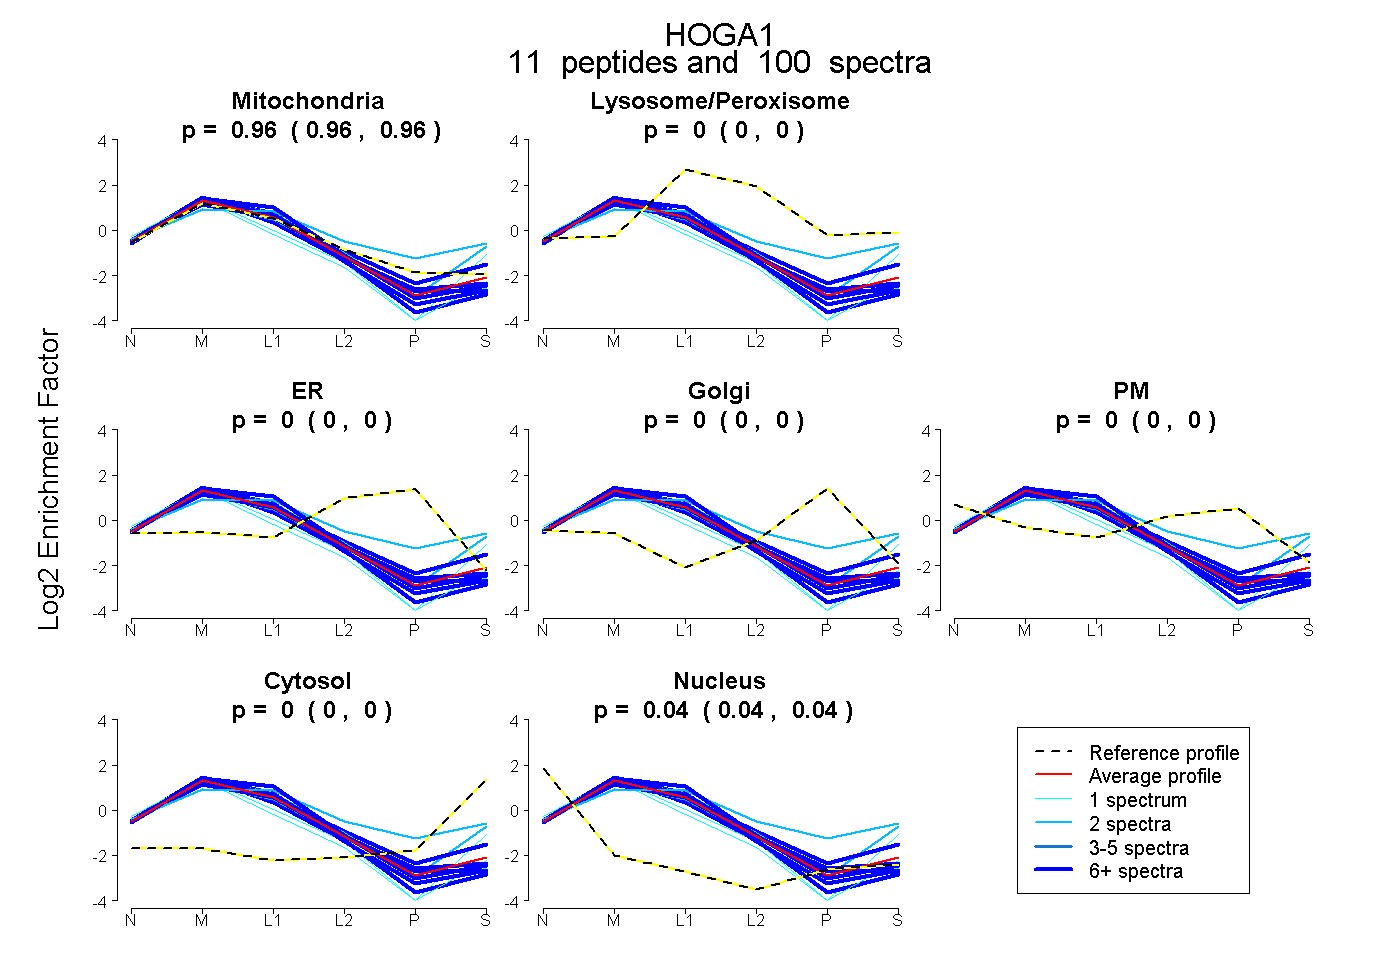 |
0.961 0.959 | 0.963 |
0.000 0.000 | 0.000 |
0.000 0.000 | 0.000 |
0.000 0.000 | 0.000 |
0.000 0.000 | 0.000 |
0.000 0.000 | 0.000 |
0.039 0.036 | 0.041 |
|||
| Plot | Lyso | Other | |||||||||||
| Expt C |
12 peptides |
551 spectra |
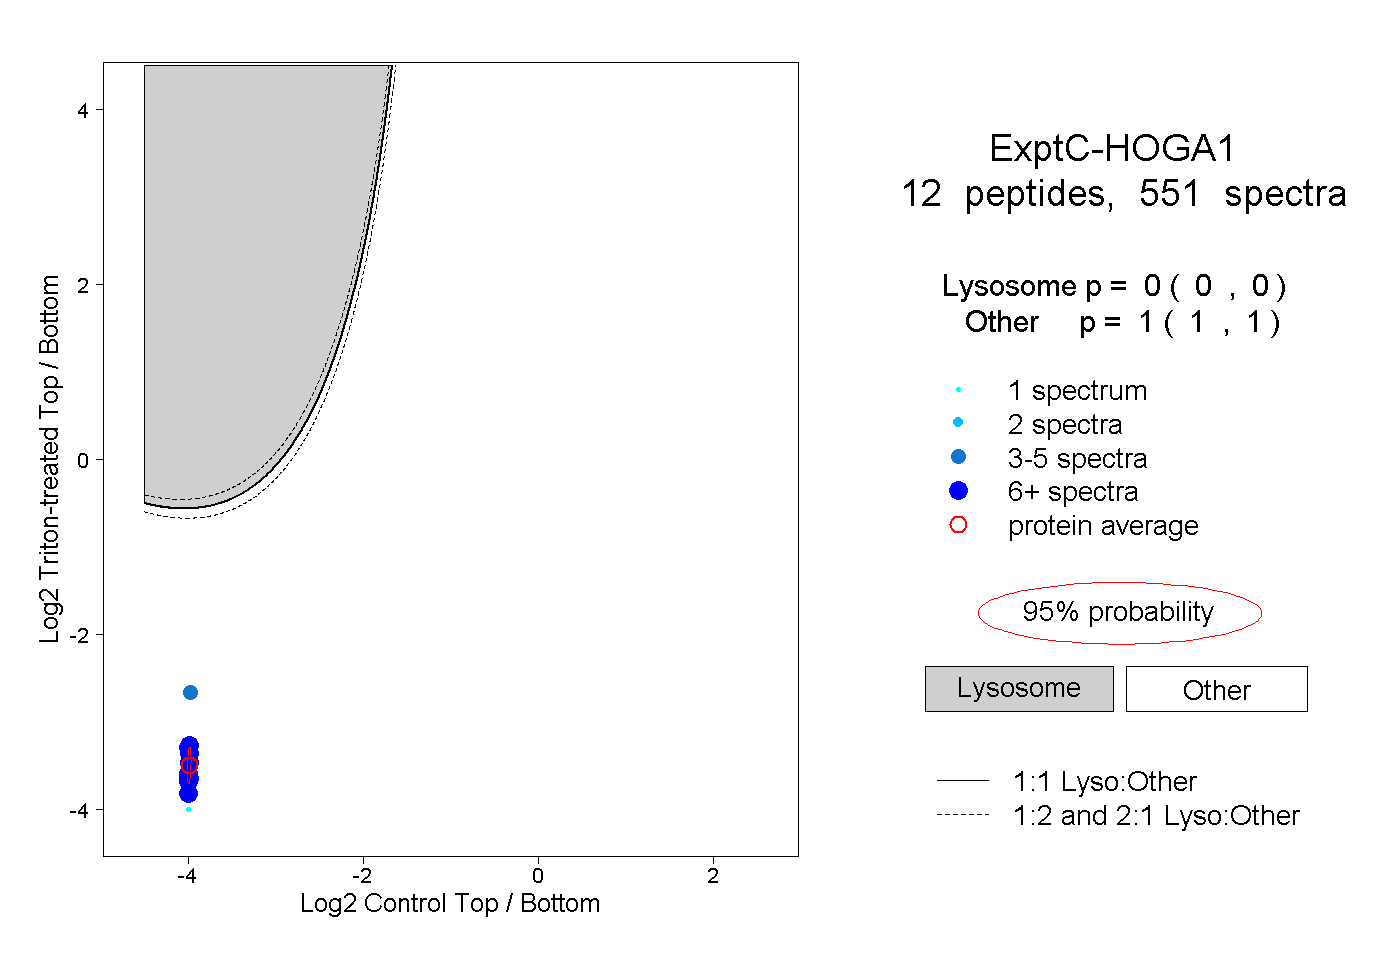 |
0.000 0.000 | 0.000 |
1.000 1.000 | 1.000 |
||||||||
| Plot | Lyso | Other | |||||||||||
| Expt D |
6 peptides |
45 spectra |
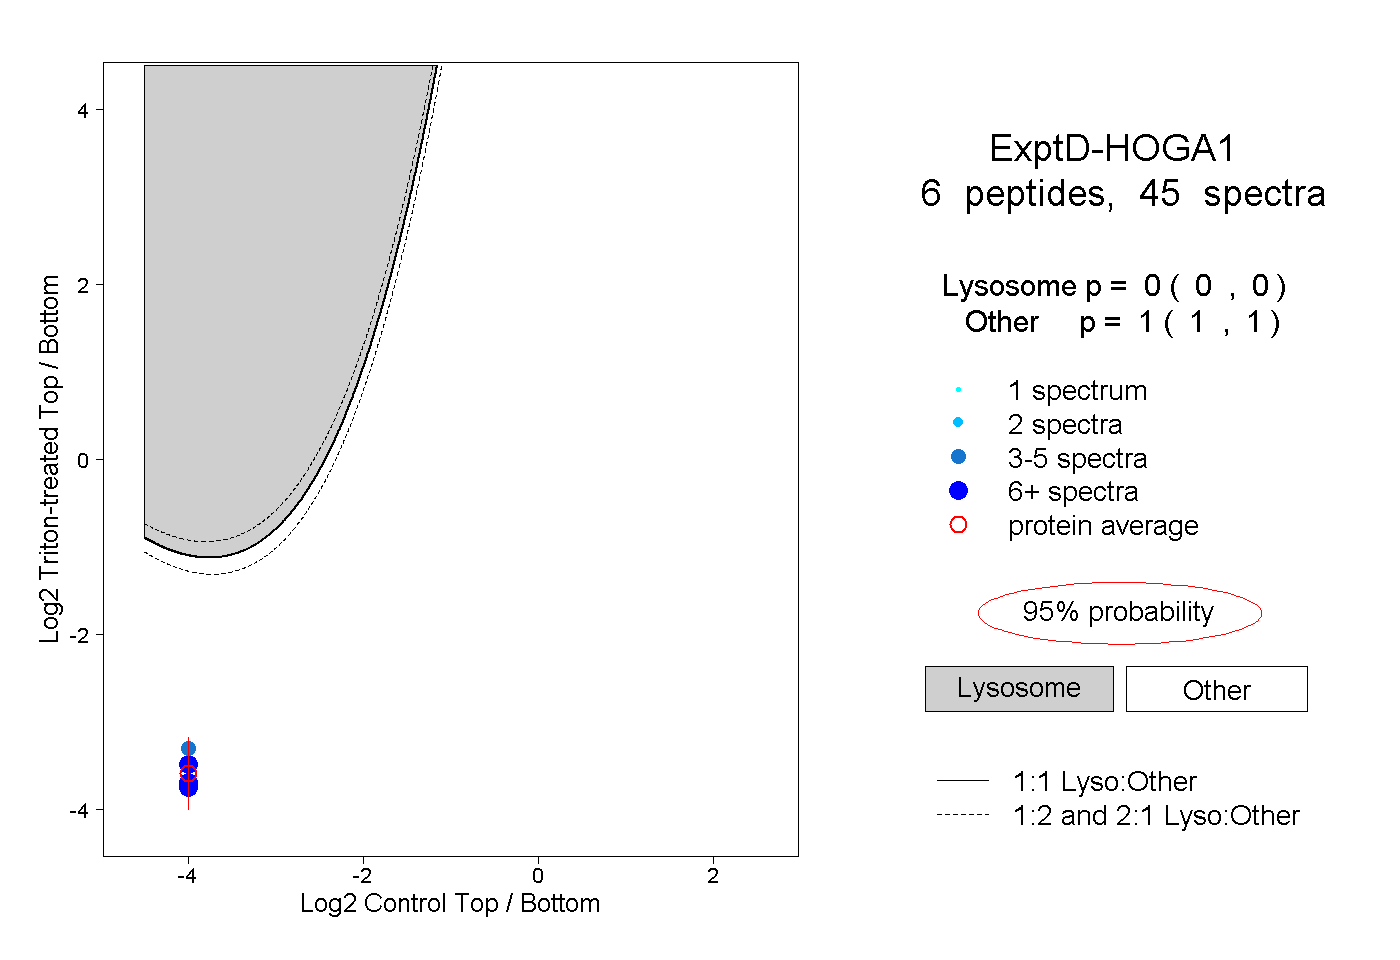 |
0.000 0.000 | 0.000 |
1.000 1.000 | 1.000 |