 2
2peptides
spectra
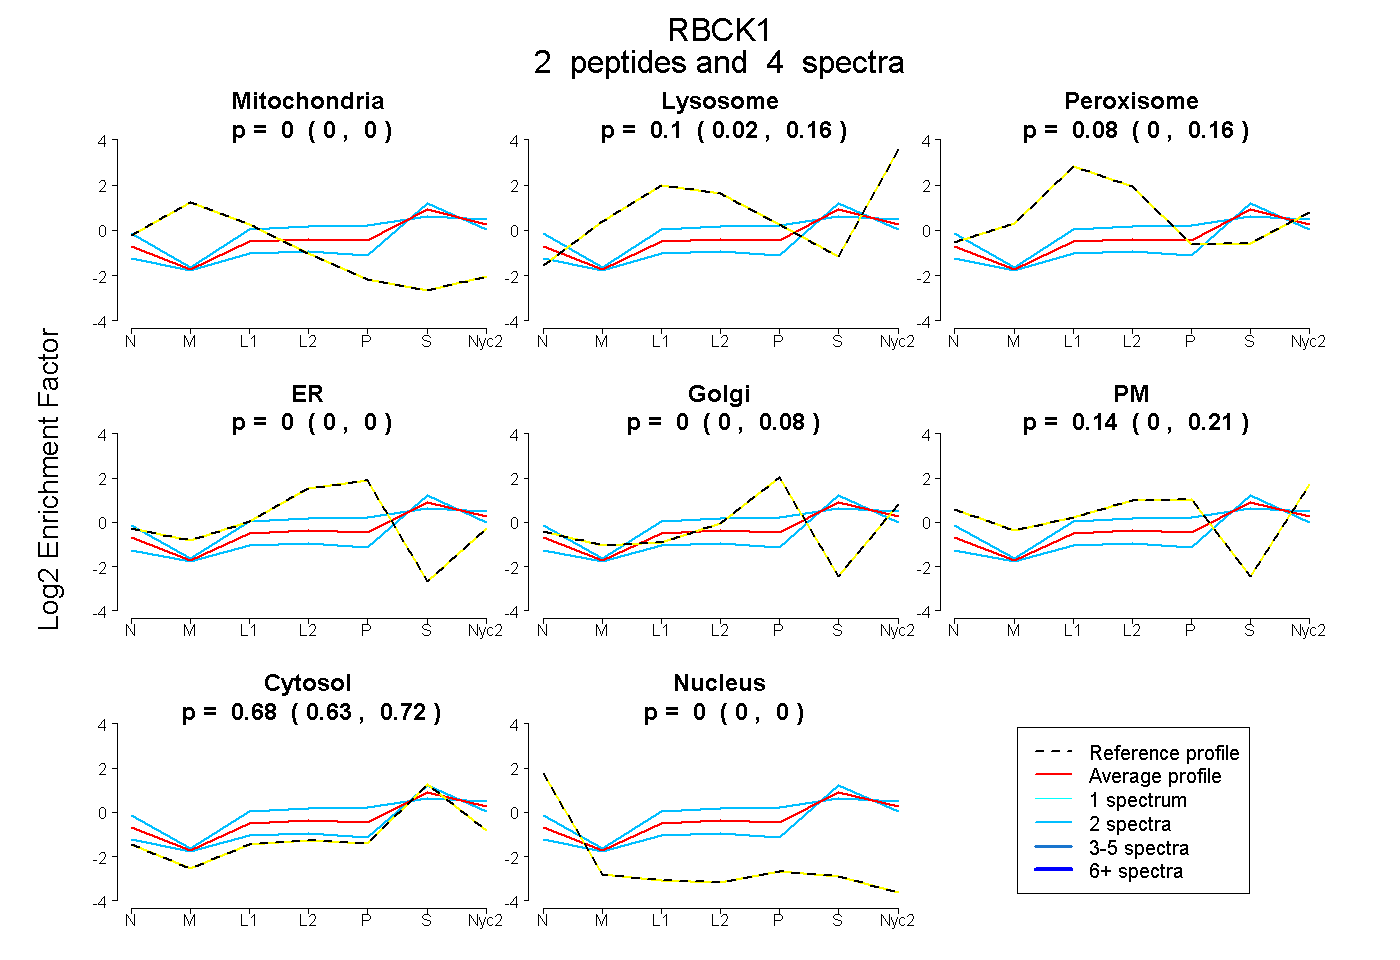
0.000 | 0.000
0.017 | 0.161
0.000 | 0.157
0.000 | 0.000
0.000 | 0.080
0.005 | 0.212
0.625 | 0.717
0.000 | 0.000
1peptide
spectrum
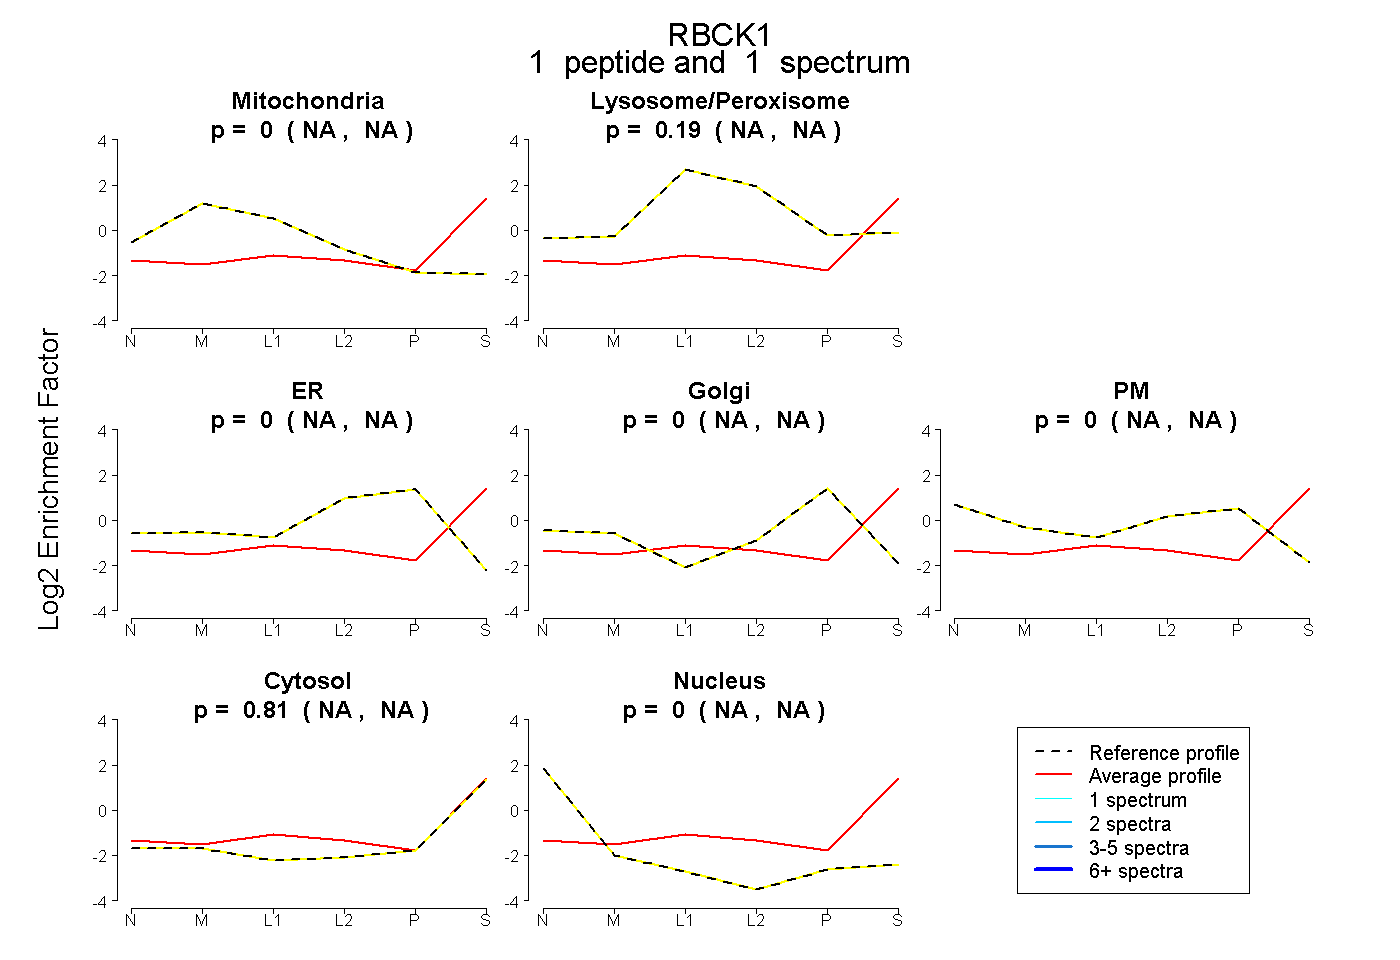
NA | NA
NA | NA
NA | NA
NA | NA
NA | NA
NA | NA
NA | NA
1peptide
spectra
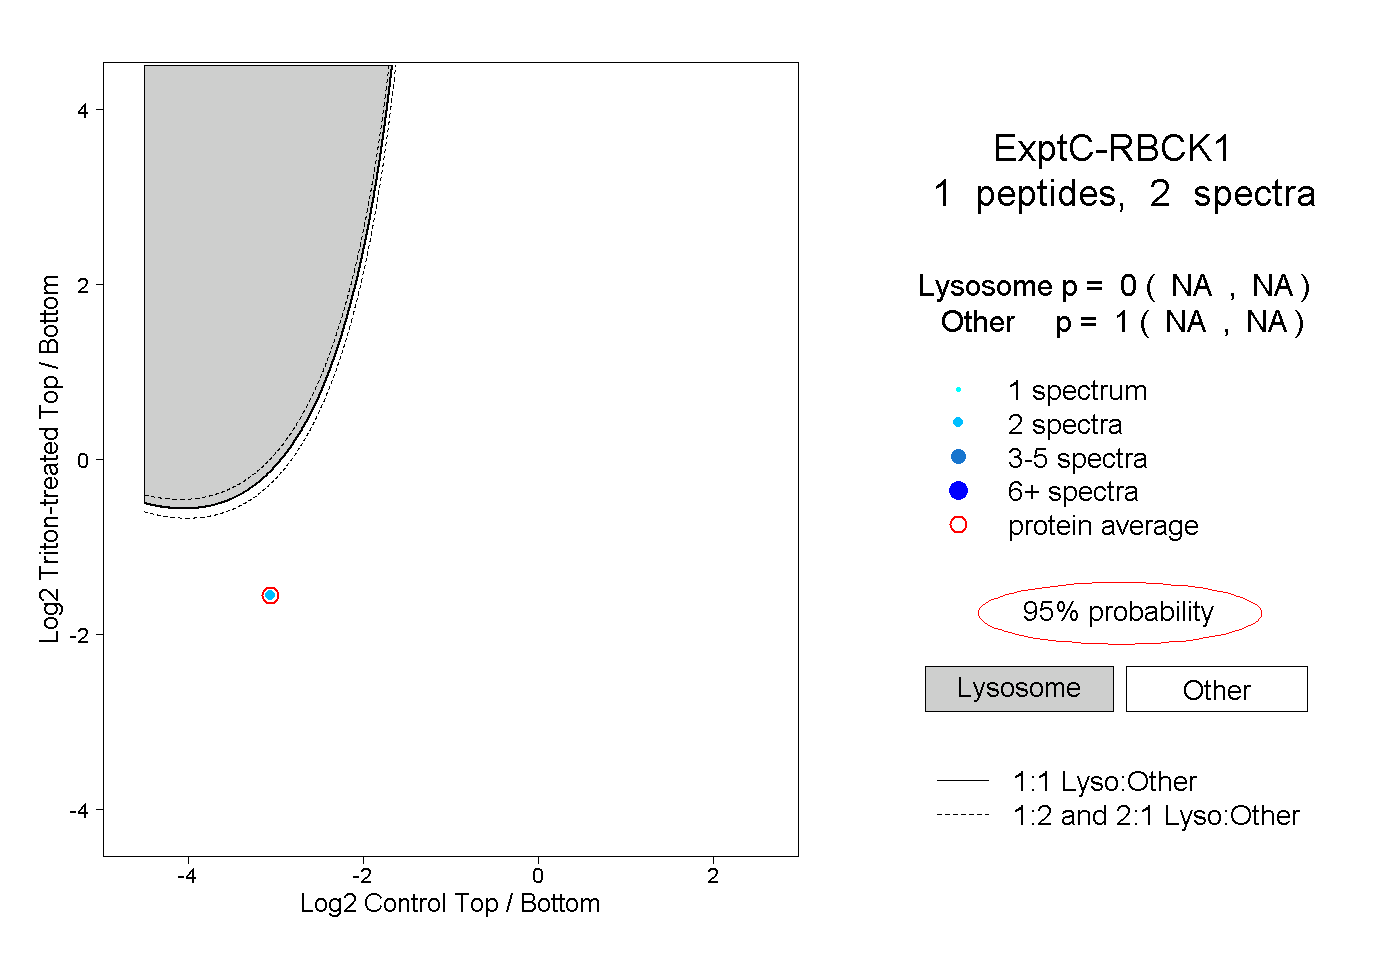
NA | NA
NA | NA