 2
2peptides
spectra
0.663 | 0.804
0.000 | 0.000
0.000 | 0.000
0.000 | 0.000
0.000 | 0.000
0.000 | 0.000
0.000 | 0.113
0.149 | 0.255
1peptide
spectra
0.000 | 0.000
1.000 | 1.000
| Plot | Mito | Lyso | Perox | ER | Golgi | PM | Cytosol | Nucleus | |||||
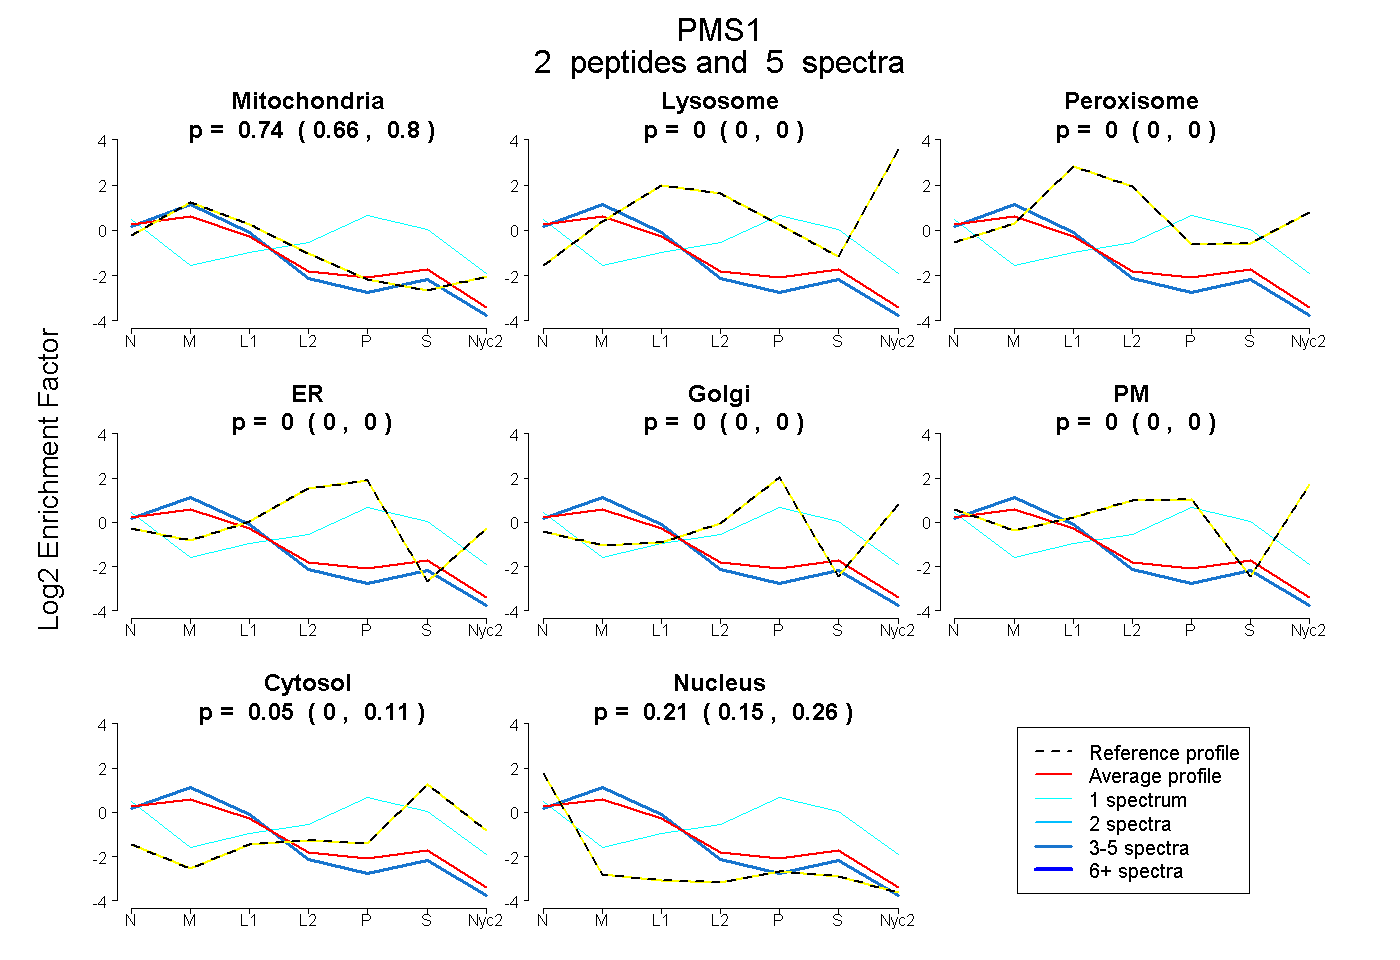
| Expt A |
2 peptides |
5 spectra |
|
0.743 0.663 | 0.804 |
0.000 0.000 | 0.000 |
0.000 0.000 | 0.000 |
0.000 0.000 | 0.000 |
0.000 0.000 | 0.000 |
0.000 0.000 | 0.000 |
0.048 0.000 | 0.113 |
0.209 0.149 | 0.255 |
||
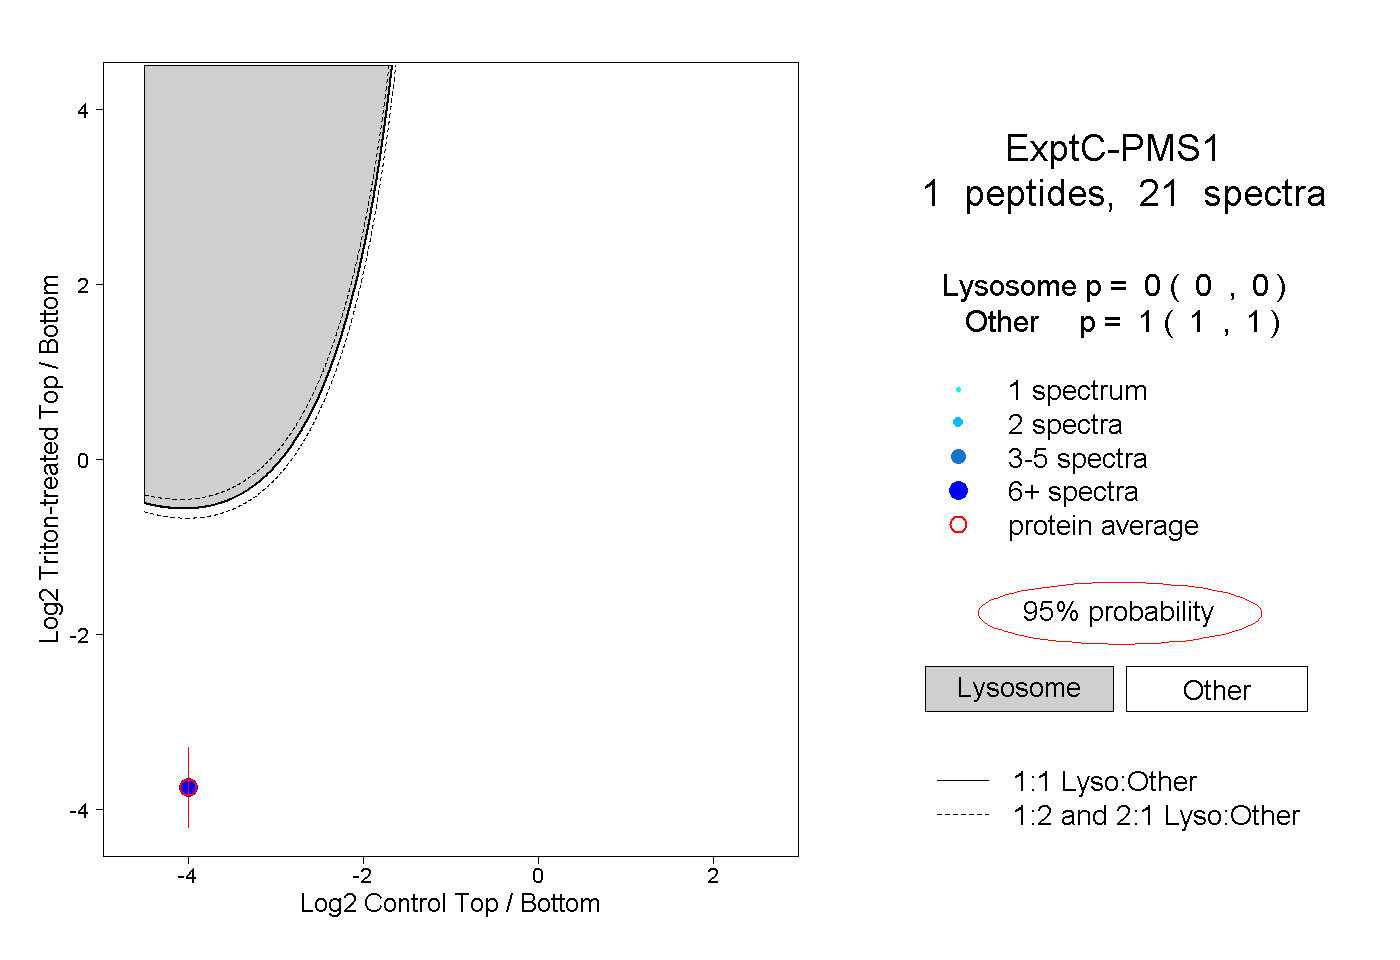
| Plot | Lyso | Other | |||||||||||
| Expt C |
1 peptide |
21 spectra |
|
0.000 0.000 | 0.000 |
1.000 1.000 | 1.000 |