 5
5peptides
spectra
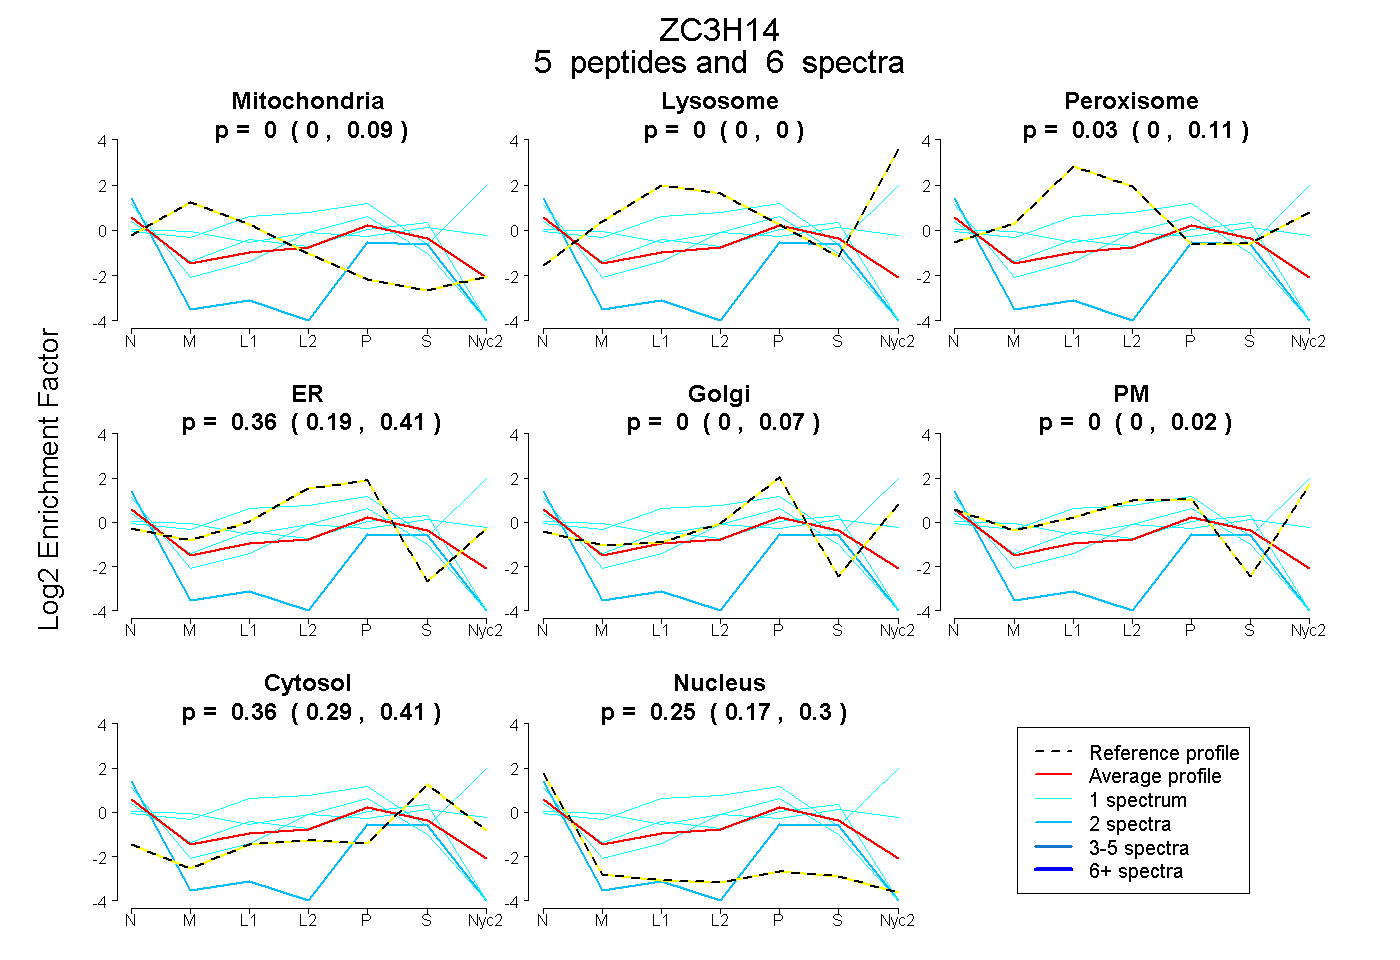
0.000 | 0.089
0.000 | 0.000
0.000 | 0.111
0.186 | 0.406
0.000 | 0.071
0.000 | 0.021
0.286 | 0.412
0.169 | 0.297
2peptides
spectra
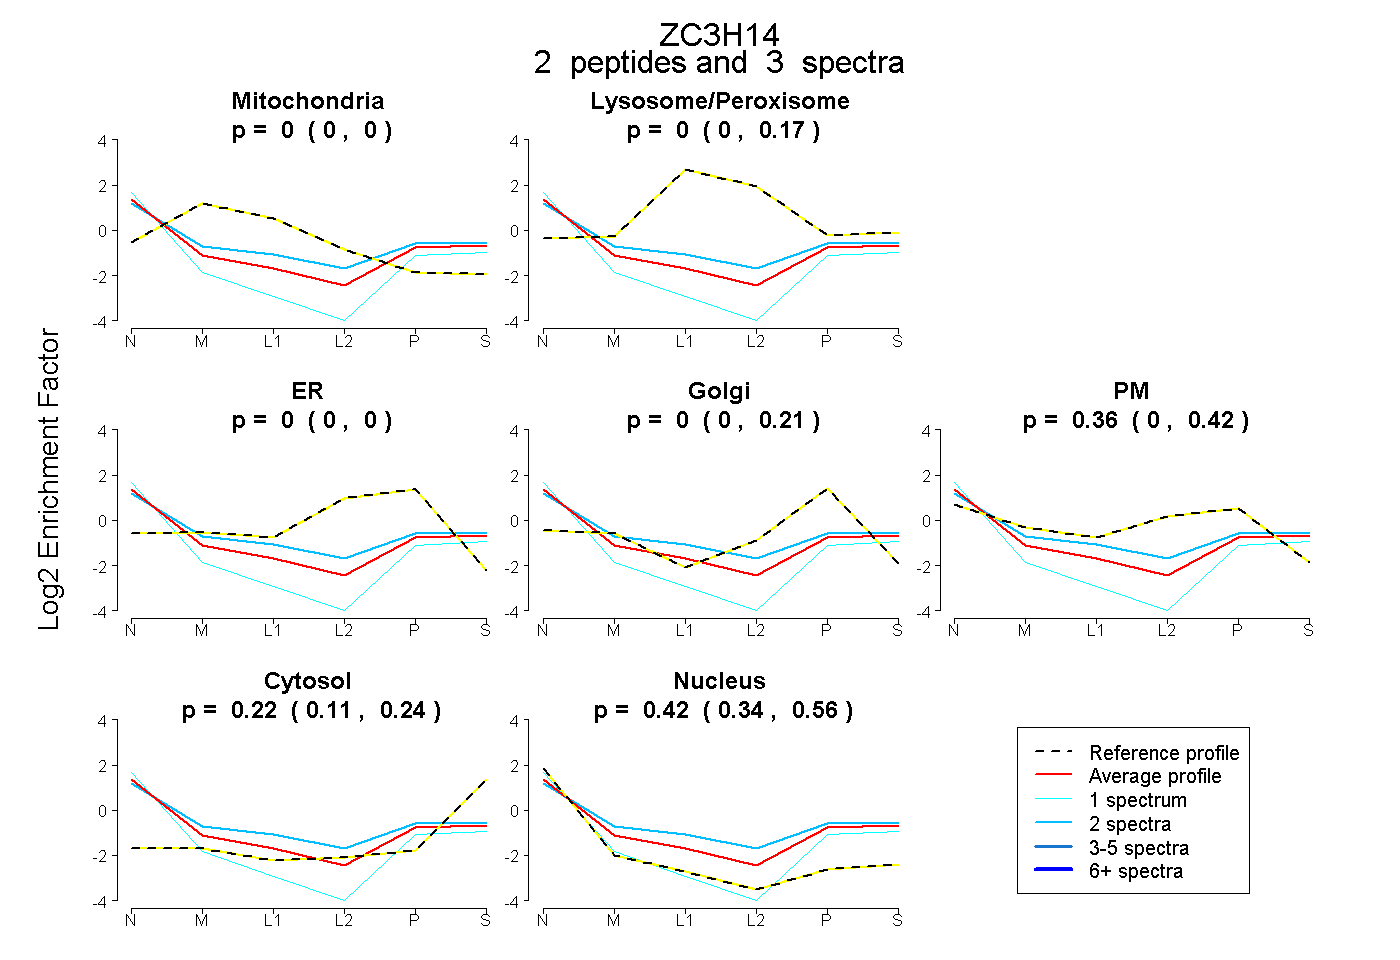
0.000 | 0.000
0.000 | 0.165
0.000 | 0.000
0.000 | 0.210
0.000 | 0.424
0.114 | 0.236
0.339 | 0.559