 3
3peptides
spectra
0.000 | 0.000
0.051 | 0.225
0.000 | 0.129
0.000 | 0.039
0.000 | 0.008
0.000 | 0.095
0.704 | 0.770
0.000 | 0.000
1peptide
spectrum
NA | NA
NA | NA
NA | NA
NA | NA
NA | NA
NA | NA
NA | NA
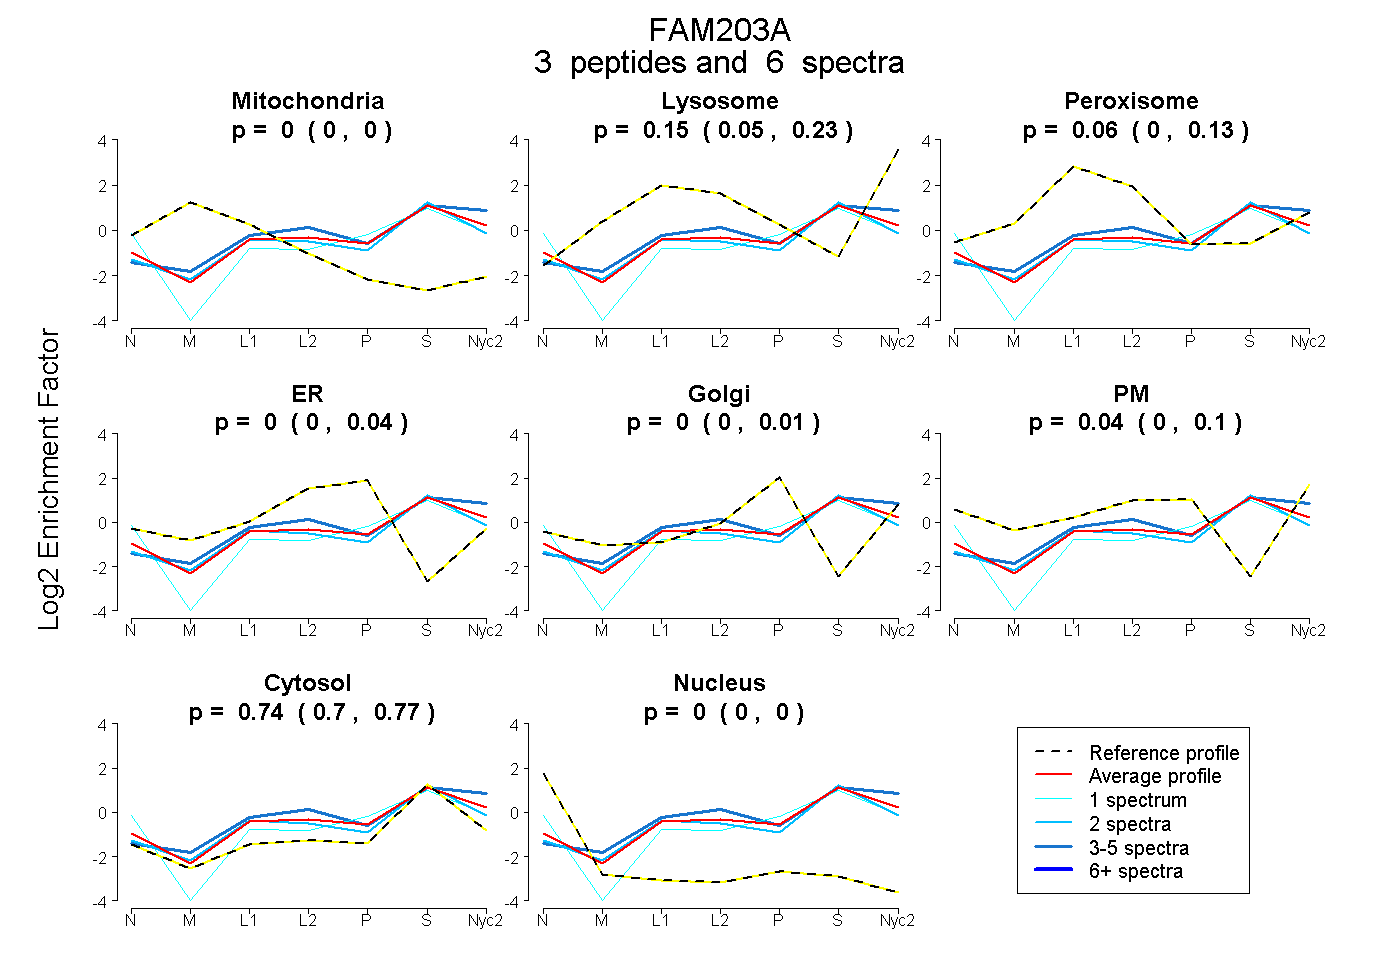
| Plot | Mito | Lyso | Perox | ER | Golgi | PM | Cytosol | Nucleus | |||||
| Expt A |
3 peptides |
6 spectra |
|
0.000 0.000 | 0.000 |
0.151 0.051 | 0.225 |
0.064 0.000 | 0.129 |
0.000 0.000 | 0.039 |
0.000 0.000 | 0.008 |
0.043 0.000 | 0.095 |
0.742 0.704 | 0.770 |
0.000 0.000 | 0.000 |
||
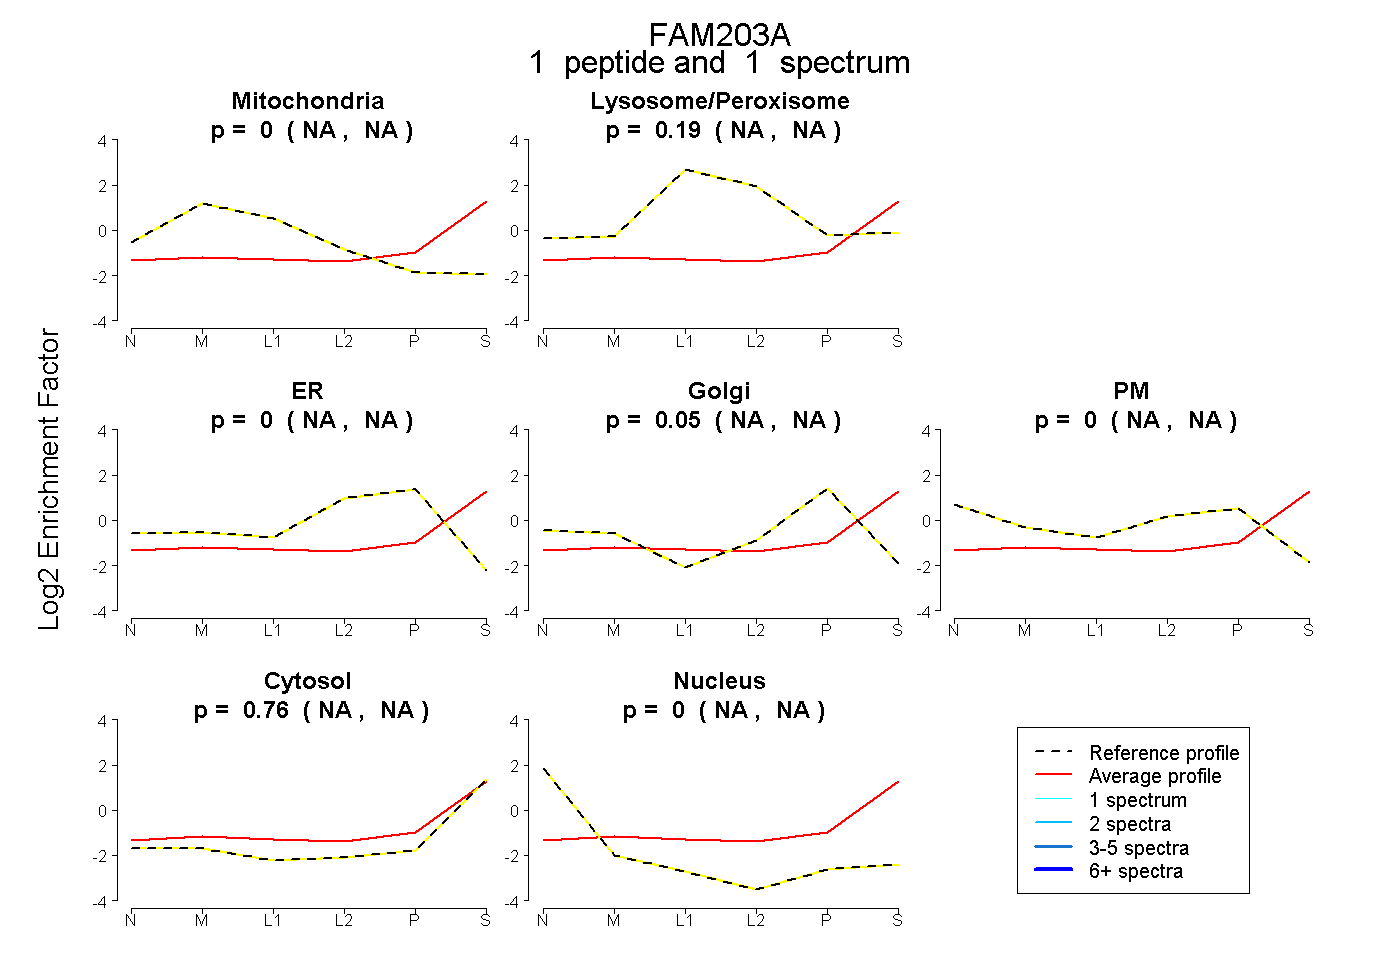
| Plot | Mito | Lyso or Perox | ER | Golgi | PM | Cytosol | Nucleus | ||||||
| Expt B |
1 peptide |
1 spectrum |
|
0.000 NA | NA |
0.185 NA | NA |
0.000 NA | NA |
0.054 NA | NA |
0.000 NA | NA |
0.761 NA | NA |
0.000 NA | NA |