 6
6peptides
spectra
0.000 | 0.000
0.025 | 0.054
0.000 | 0.009
0.069 | 0.094
0.000 | 0.000
0.000 | 0.000
0.865 | 0.881
0.000 | 0.000
| Plot | Mito | Lyso | Perox | ER | Golgi | PM | Cytosol | Nucleus | |||||
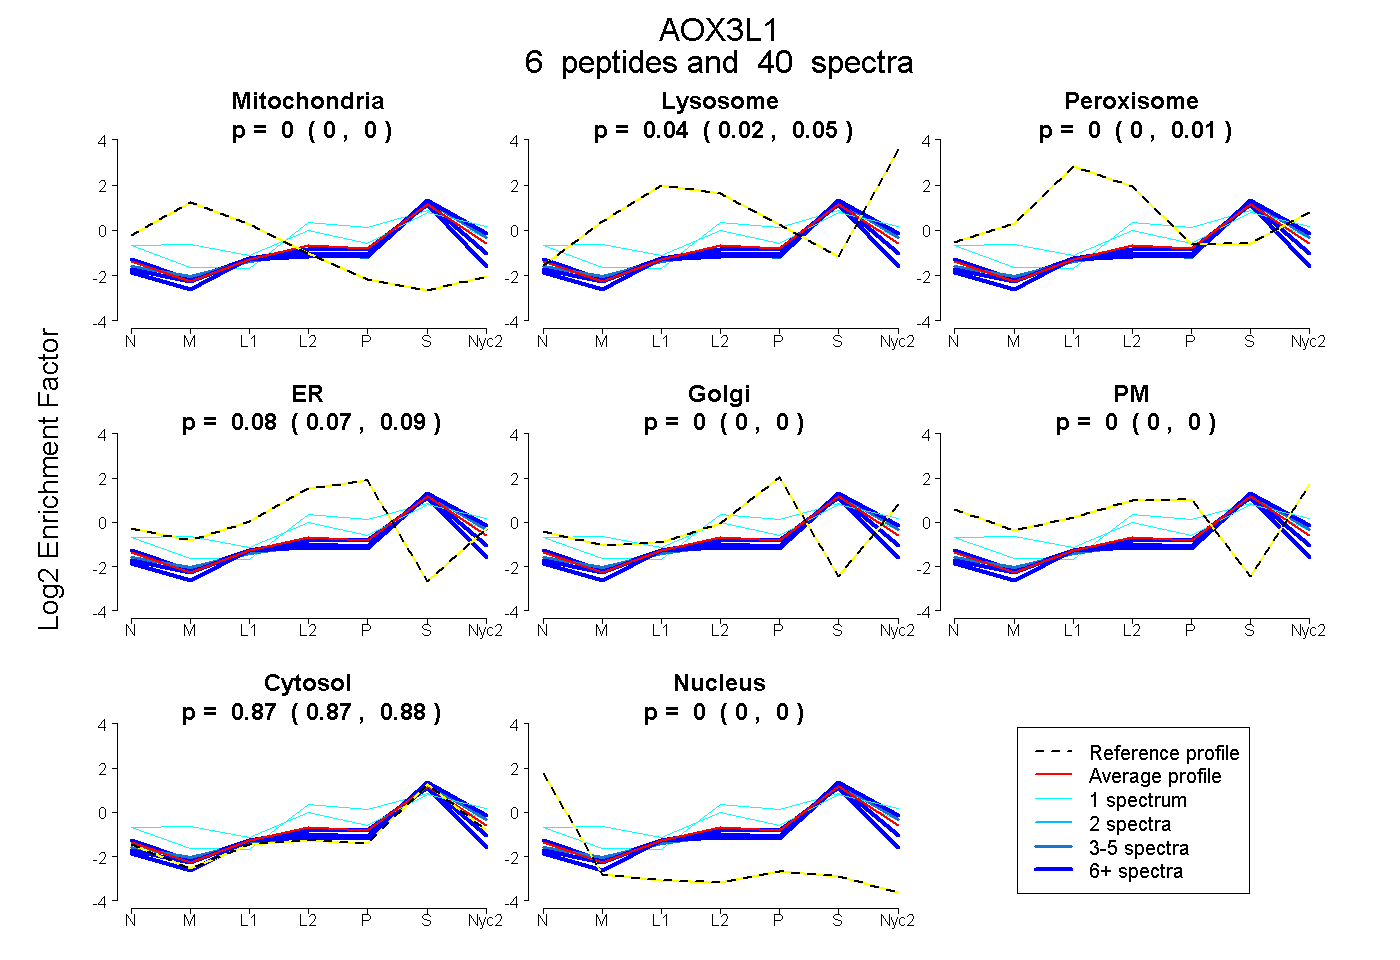
| Expt A |
6 peptides |
40 spectra |
|
0.000 0.000 | 0.000 |
0.043 0.025 | 0.054 |
0.000 0.000 | 0.009 |
0.083 0.069 | 0.094 |
0.000 0.000 | 0.000 |
0.000 0.000 | 0.000 |
0.874 0.865 | 0.881 |
0.000 0.000 | 0.000 |
| 1 spectrum, CTGYRPILESGR | 0.000 | 0.000 | 0.000 | 0.275 | 0.000 | 0.058 | 0.667 | 0.000 | ||
| 8 spectra, SCQQLLGR | 0.009 | 0.000 | 0.018 | 0.017 | 0.000 | 0.000 | 0.956 | 0.000 | ||
| 6 spectra, ITCHVK | 0.017 | 0.000 | 0.000 | 0.091 | 0.000 | 0.000 | 0.886 | 0.006 | ||
| 20 spectra, MLQVASR | 0.000 | 0.081 | 0.000 | 0.000 | 0.000 | 0.000 | 0.919 | 0.000 | ||
| 1 spectrum, TGRPIR | 0.024 | 0.097 | 0.064 | 0.000 | 0.000 | 0.194 | 0.621 | 0.000 | ||
| 4 spectra, LENAYK | 0.000 | 0.087 | 0.000 | 0.000 | 0.000 | 0.000 | 0.913 | 0.000 |
| Plot | Mito | Lyso or Perox | ER | Golgi | PM | Cytosol | Nucleus | ||||||
| Expt B |
6 peptides |
34 spectra |
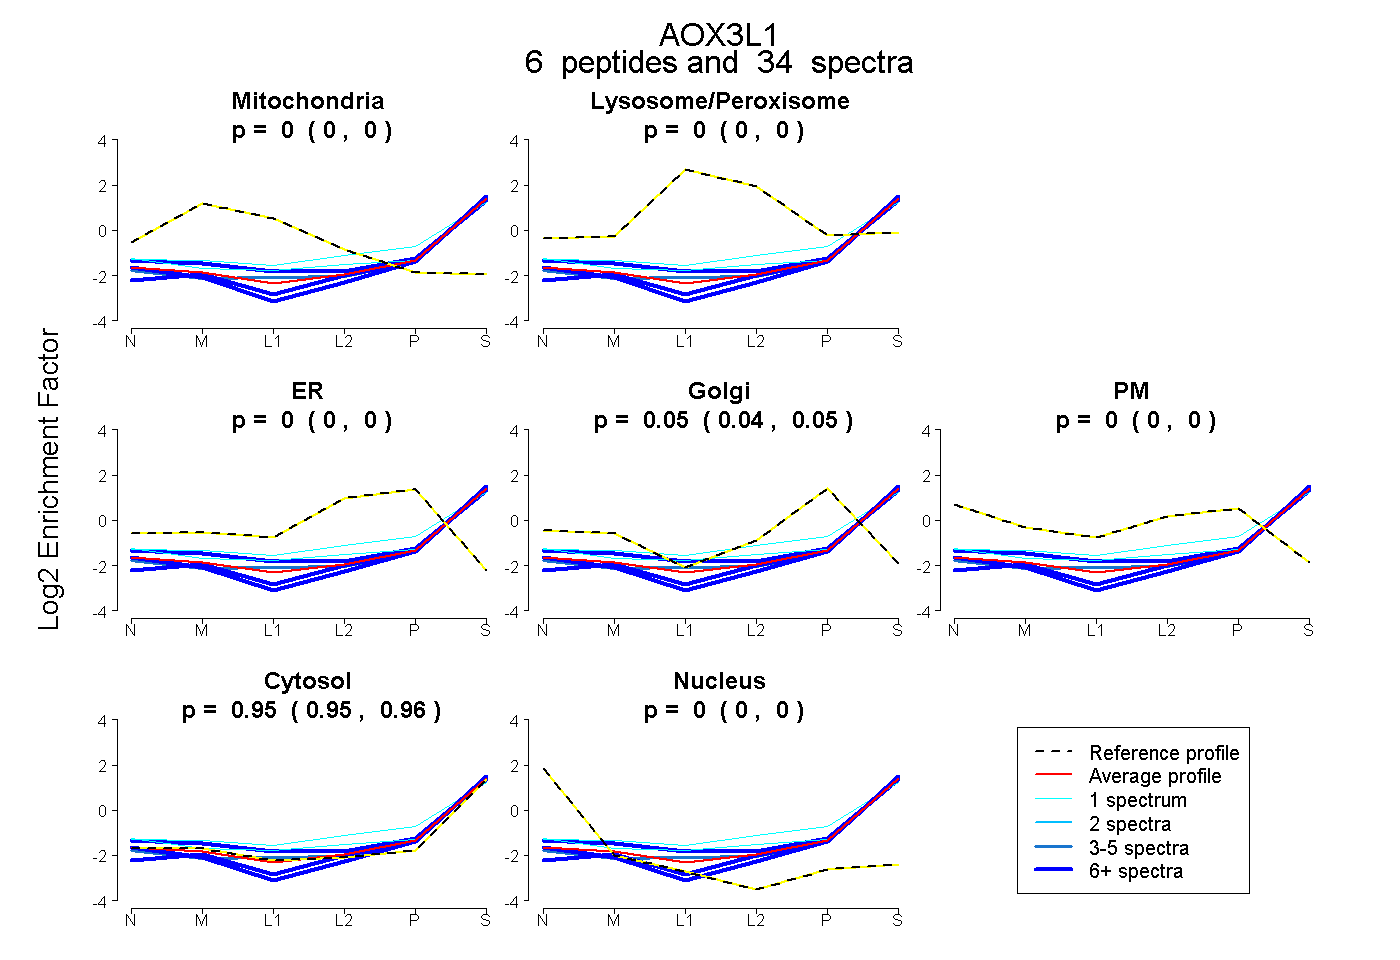 |
0.000 0.000 | 0.000 |
0.000 0.000 | 0.000 |
0.000 0.000 | 0.000 |
0.048 0.043 | 0.052 |
0.000 0.000 | 0.000 |
0.952 0.947 | 0.956 |
0.000 0.000 | 0.000 |
|||
| Plot | Lyso | Other | |||||||||||
| Expt C |
7 peptides |
51 spectra |
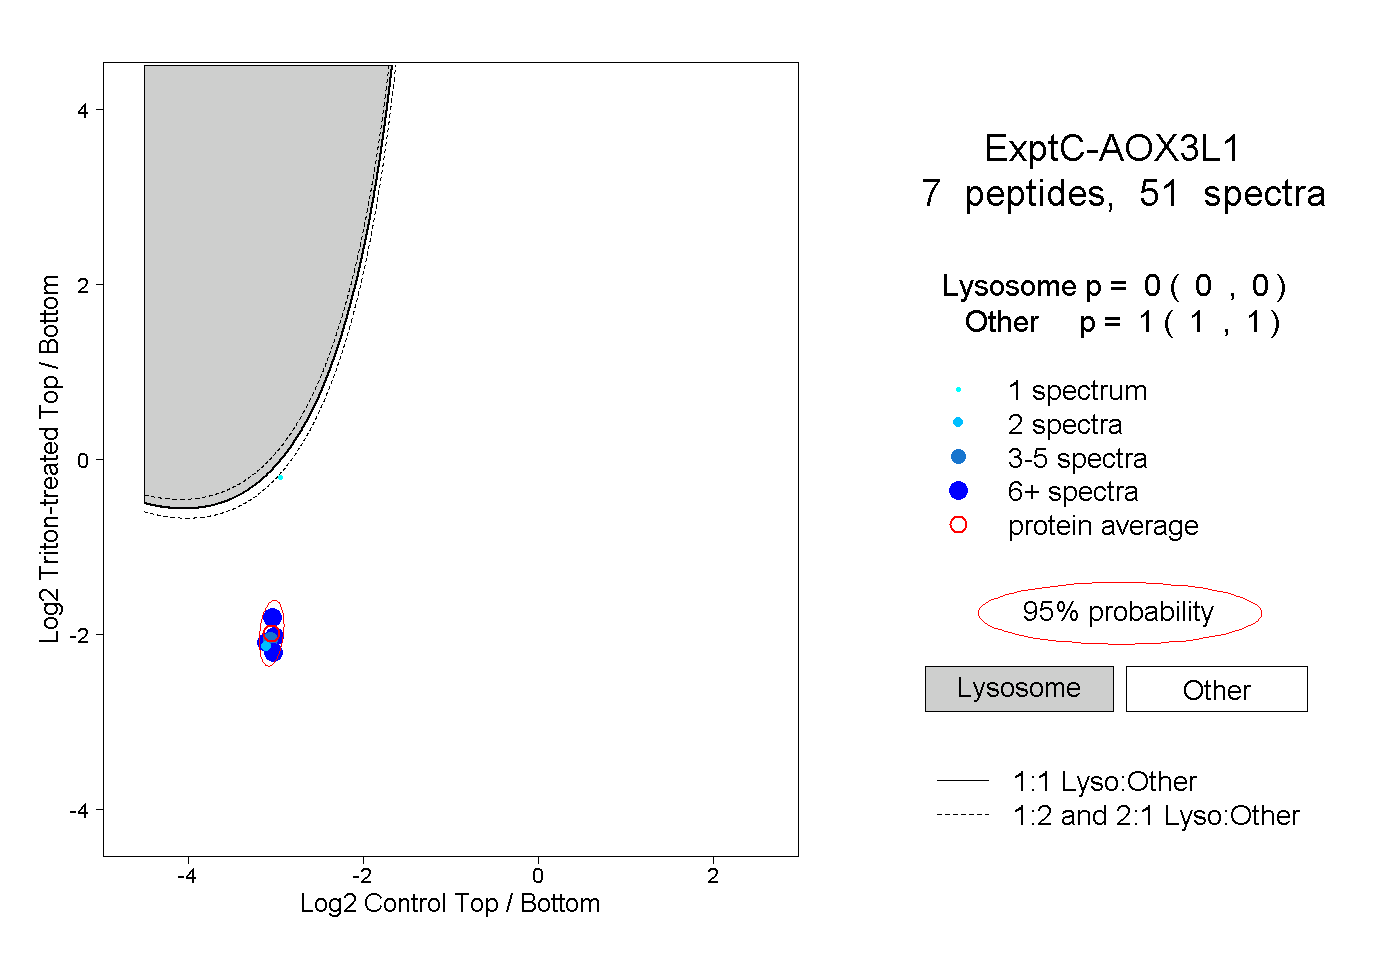 |
0.000 0.000 | 0.000 |
1.000 1.000 | 1.000 |
||||||||
| Plot | Lyso | Other | |||||||||||
| Expt D |
2 peptides |
8 spectra |
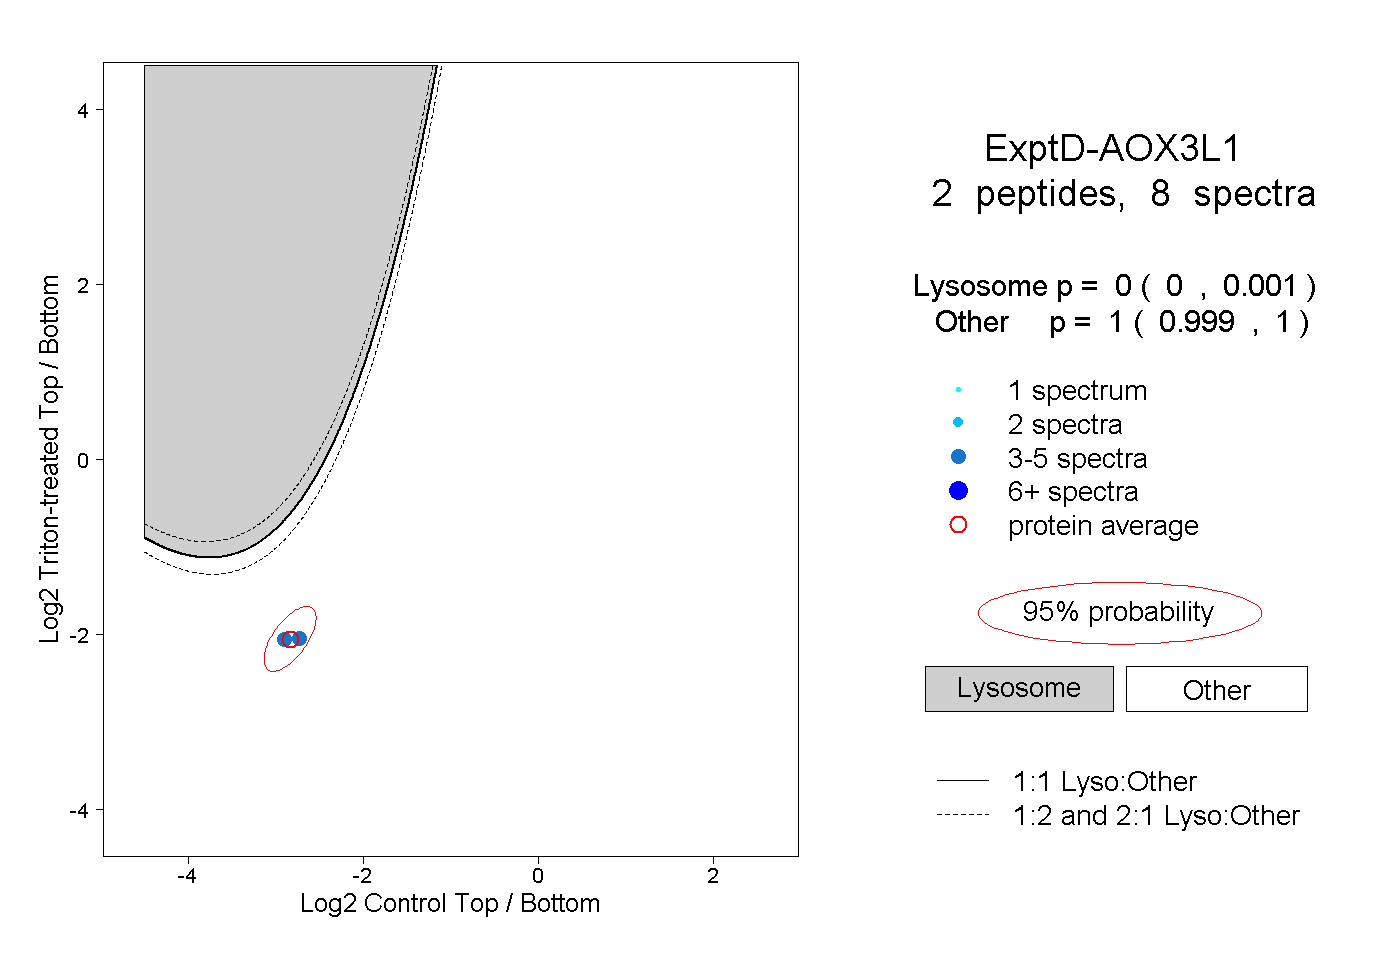 |
0.000 0.000 | 0.001 |
1.000 0.999 | 1.000 |