 3
3peptides
spectra
0.000 | 0.206
0.000 | 0.000
0.000 | 0.194
0.254 | 0.789
0.000 | 0.173
0.000 | 0.302
0.000 | 0.197
0.000 | 0.167
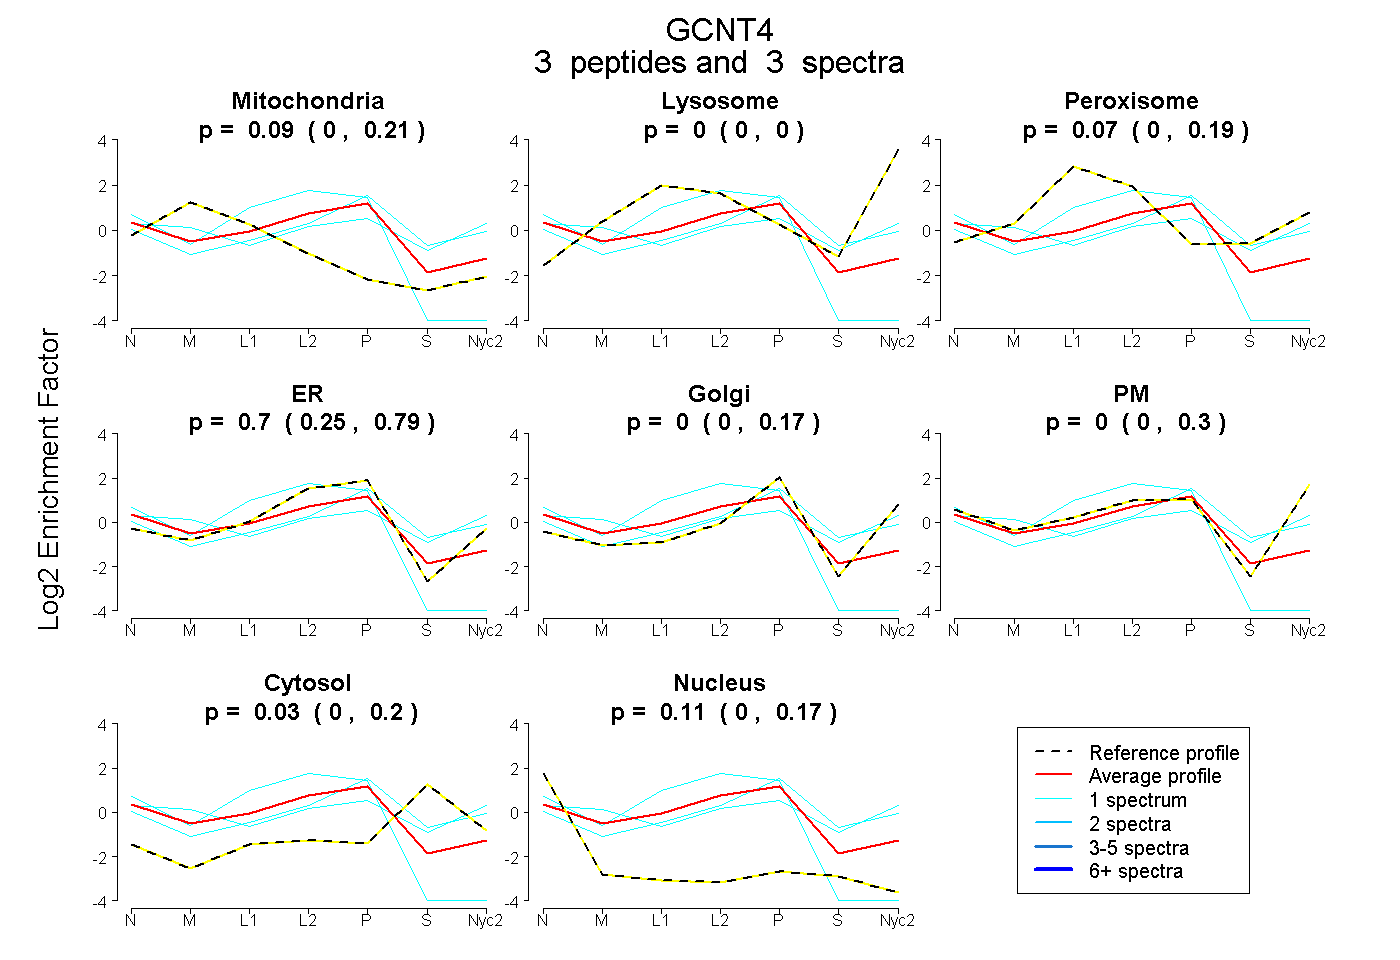
| Plot | Mito | Lyso | Perox | ER | Golgi | PM | Cytosol | Nucleus | |||||
| Expt A |
3 peptides |
3 spectra |
|
0.088 0.000 | 0.206 |
0.000 0.000 | 0.000 |
0.072 0.000 | 0.194 |
0.701 0.254 | 0.789 |
0.000 0.000 | 0.173 |
0.000 0.000 | 0.302 |
0.032 0.000 | 0.197 |
0.107 0.000 | 0.167 |
| 1 spectrum, LLFPQR | 0.182 | 0.000 | 0.000 | 0.724 | 0.000 | 0.000 | 0.000 | 0.094 | ||
| 1 spectrum, QYHEKPVSR | 0.144 | 0.000 | 0.000 | 0.000 | 0.085 | 0.542 | 0.229 | 0.000 | ||
| 1 spectrum, LQADWNCLSDLLK | 0.000 | 0.000 | 0.046 | 0.334 | 0.301 | 0.055 | 0.264 | 0.000 |