TBC1D9B
[ENSRNOP00000047447]
Main page
| | | Plot |
Mito |
Lyso |
|
Perox |
ER |
Golgi |
PM |
Cytosol |
Nucleus |
|
| Expt A |
 9
9
peptides |
21
spectra |
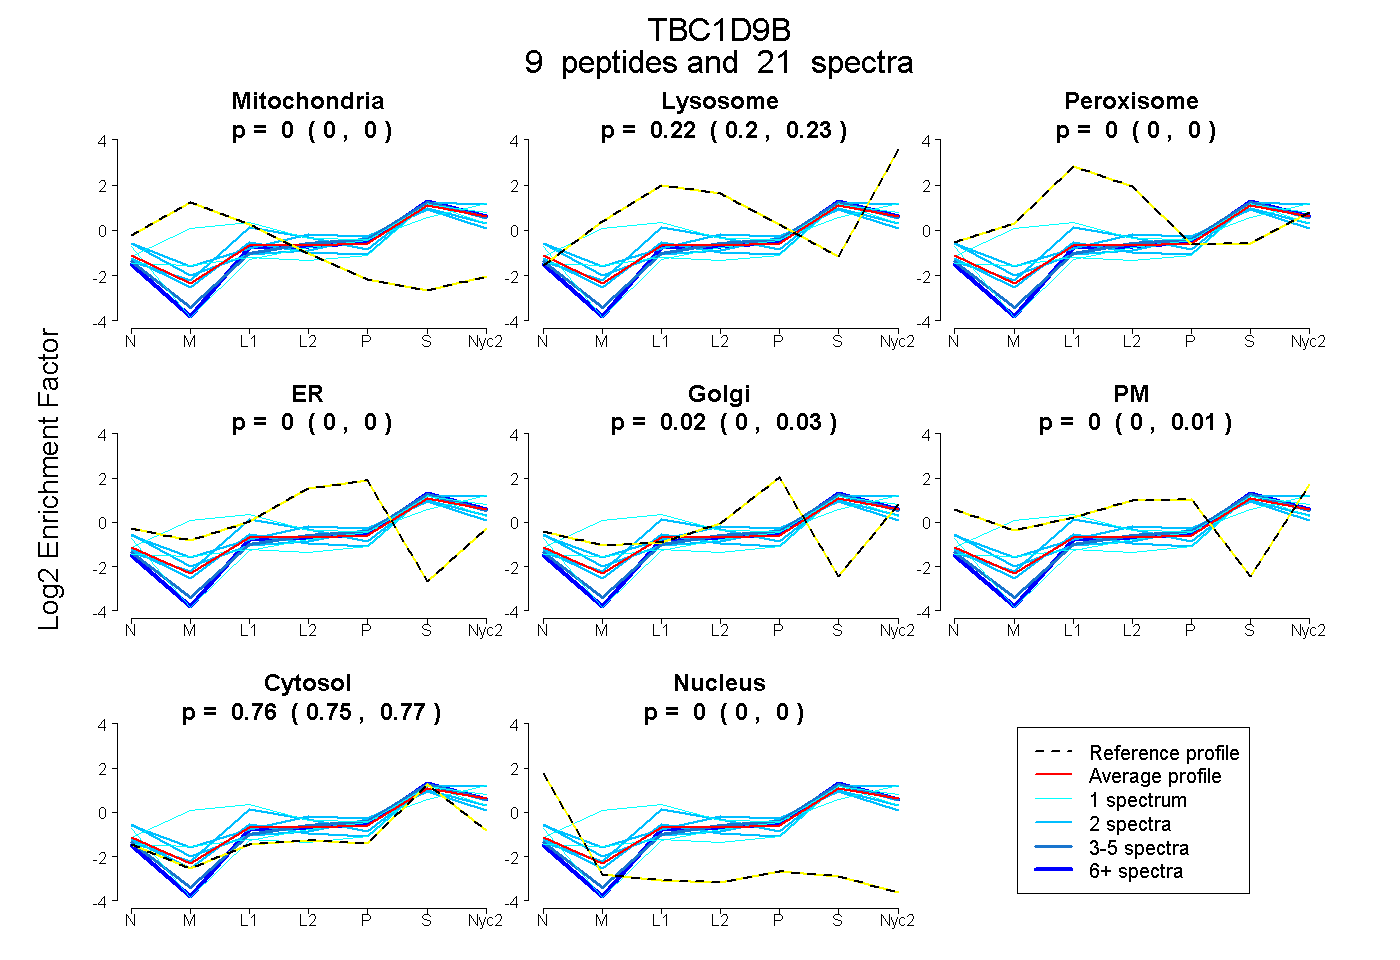 |
0.000
0.000 | 0.000 |
0.219
0.203 | 0.231 |
|
0.000
0.000 | 0.000 |
0.000
0.000 | 0.000 |
0.016
0.000 | 0.026 |
0.000
0.000 | 0.015 |
0.765
0.754 | 0.773 |
0.000
0.000 | 0.000 |
|
| | | Plot |
Mito |
|
Lyso or Perox |
|
ER |
Golgi |
PM |
Cytosol |
Nucleus |
|
| Expt B |
4
peptides |
4
spectra |
 |
0.000
0.000 | 0.050 |
|
0.090
0.011 | 0.153 |
|
0.000
0.000 | 0.000 |
0.000
0.000 | 0.036 |
0.157
0.030 | 0.219 |
0.753
0.693 | 0.792 |
0.000
0.000 | 0.013 |
|
| 1 spectrum, ANPFFVLQR |
0.321 |
|
0.077 |
|
0.000 |
0.000 |
0.196 |
0.406 |
0.000 |
|
| 1 spectrum, YSLATEEIER |
0.000 |
|
0.000 |
|
0.065 |
0.037 |
0.000 |
0.898 |
0.000 |
|
| 1 spectrum, IDASQFR |
0.000 |
|
0.209 |
|
0.000 |
0.000 |
0.040 |
0.750 |
0.000 |
|
| 1 spectrum, QLLDSEGFLEDK |
0.000 |
|
0.000 |
|
0.000 |
0.000 |
0.112 |
0.888 |
0.000 |
|
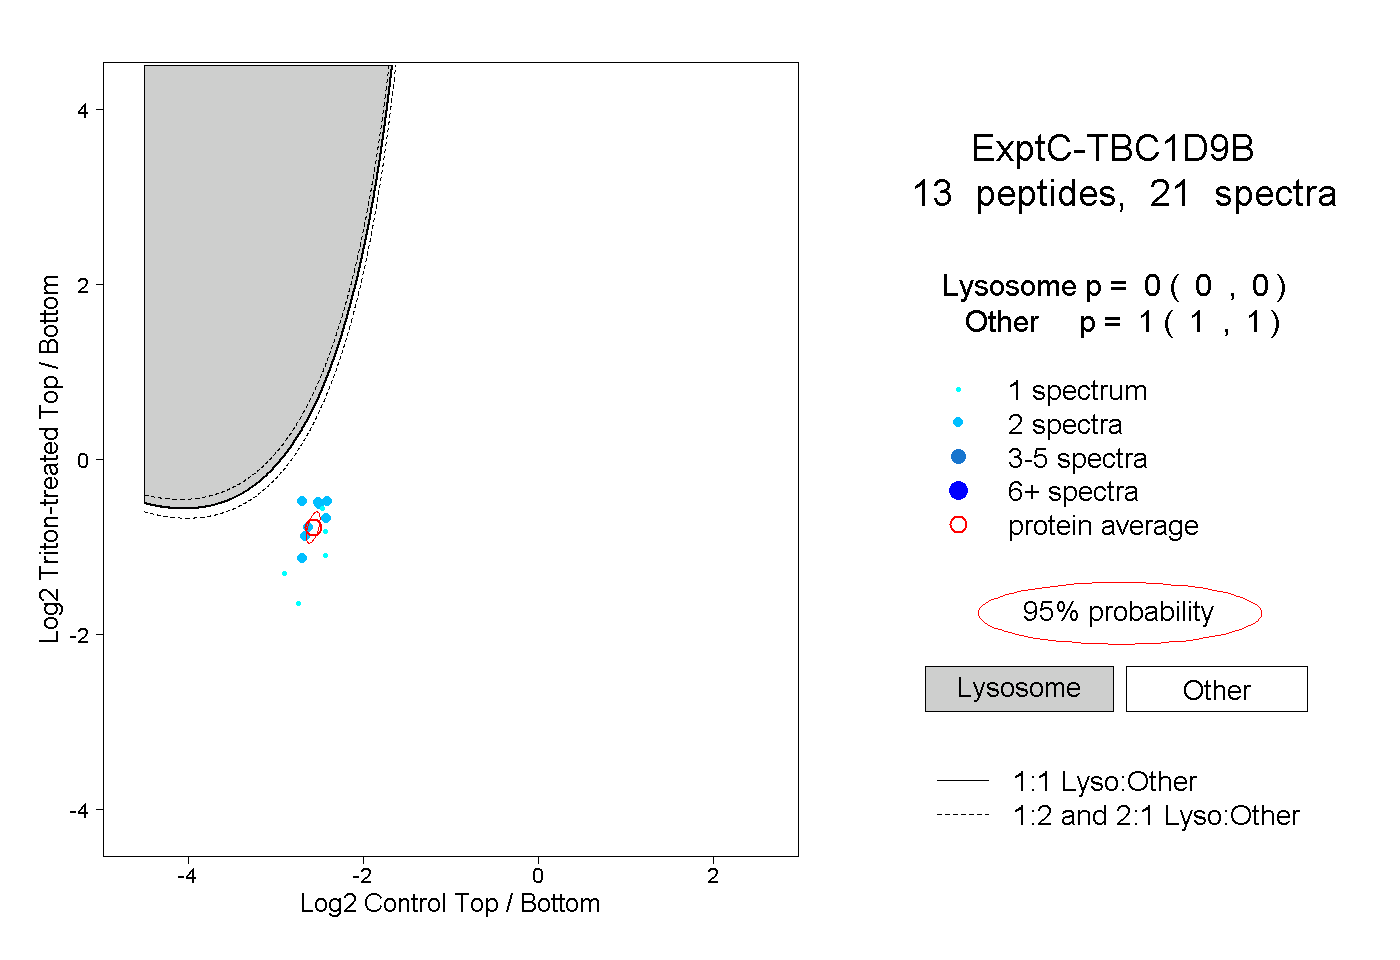
| | | Plot |
|
Lyso |
|
|
|
|
|
|
|
Other |
| Expt C |
13
peptides |
21
spectra |
 |
|
0.000
0.000 | 0.000 |
|
|
|
|
|
|
|
1.000
1.000 | 1.000 |