 3
3peptides
spectra
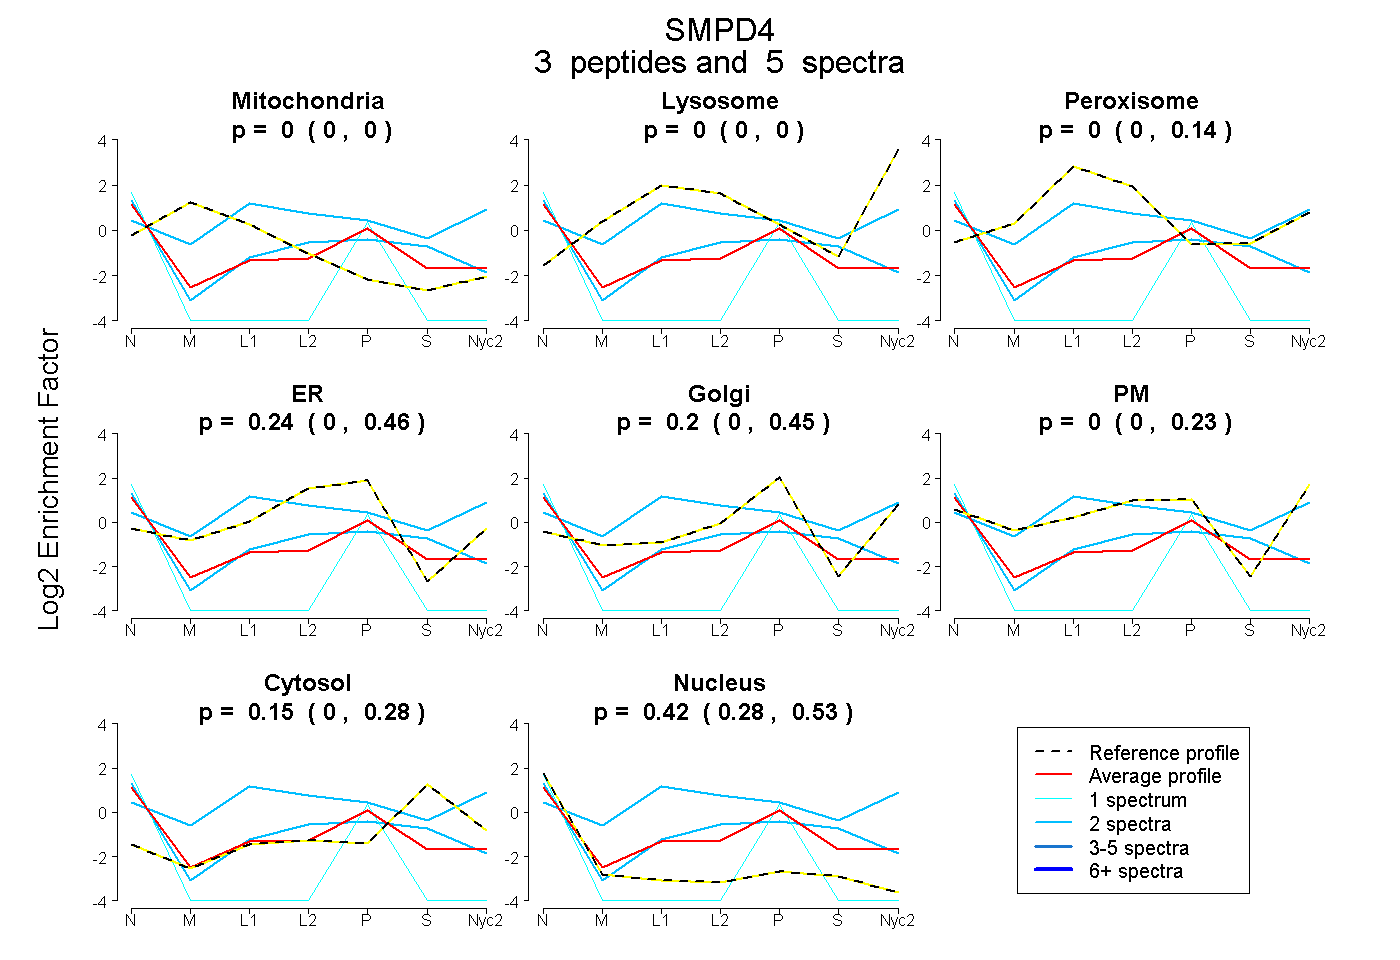
0.000 | 0.000
0.000 | 0.000
0.000 | 0.143
0.000 | 0.465
0.000 | 0.455
0.000 | 0.232
0.000 | 0.276
0.283 | 0.533
| Plot | Mito | Lyso | Perox | ER | Golgi | PM | Cytosol | Nucleus | |||||
| Expt A |
3 peptides |
5 spectra |
|
0.000 0.000 | 0.000 |
0.000 0.000 | 0.000 |
0.000 0.000 | 0.143 |
0.240 0.000 | 0.465 |
0.196 0.000 | 0.455 |
0.000 0.000 | 0.232 |
0.147 0.000 | 0.276 |
0.417 0.283 | 0.533 |
| 2 spectra, SISDQCVESPTGR | 0.000 | 0.000 | 0.398 | 0.000 | 0.000 | 0.418 | 0.184 | 0.000 | ||
| 2 spectra, GEQLFLEPELIIPHR | 0.000 | 0.000 | 0.000 | 0.313 | 0.000 | 0.000 | 0.336 | 0.351 | ||
| 1 spectrum, LEVLHYR | 0.000 | 0.000 | 0.000 | 0.000 | 0.085 | 0.000 | 0.000 | 0.915 |
| Plot | Lyso | Other | |||||||||||
| Expt C |
1 peptide |
1 spectrum |
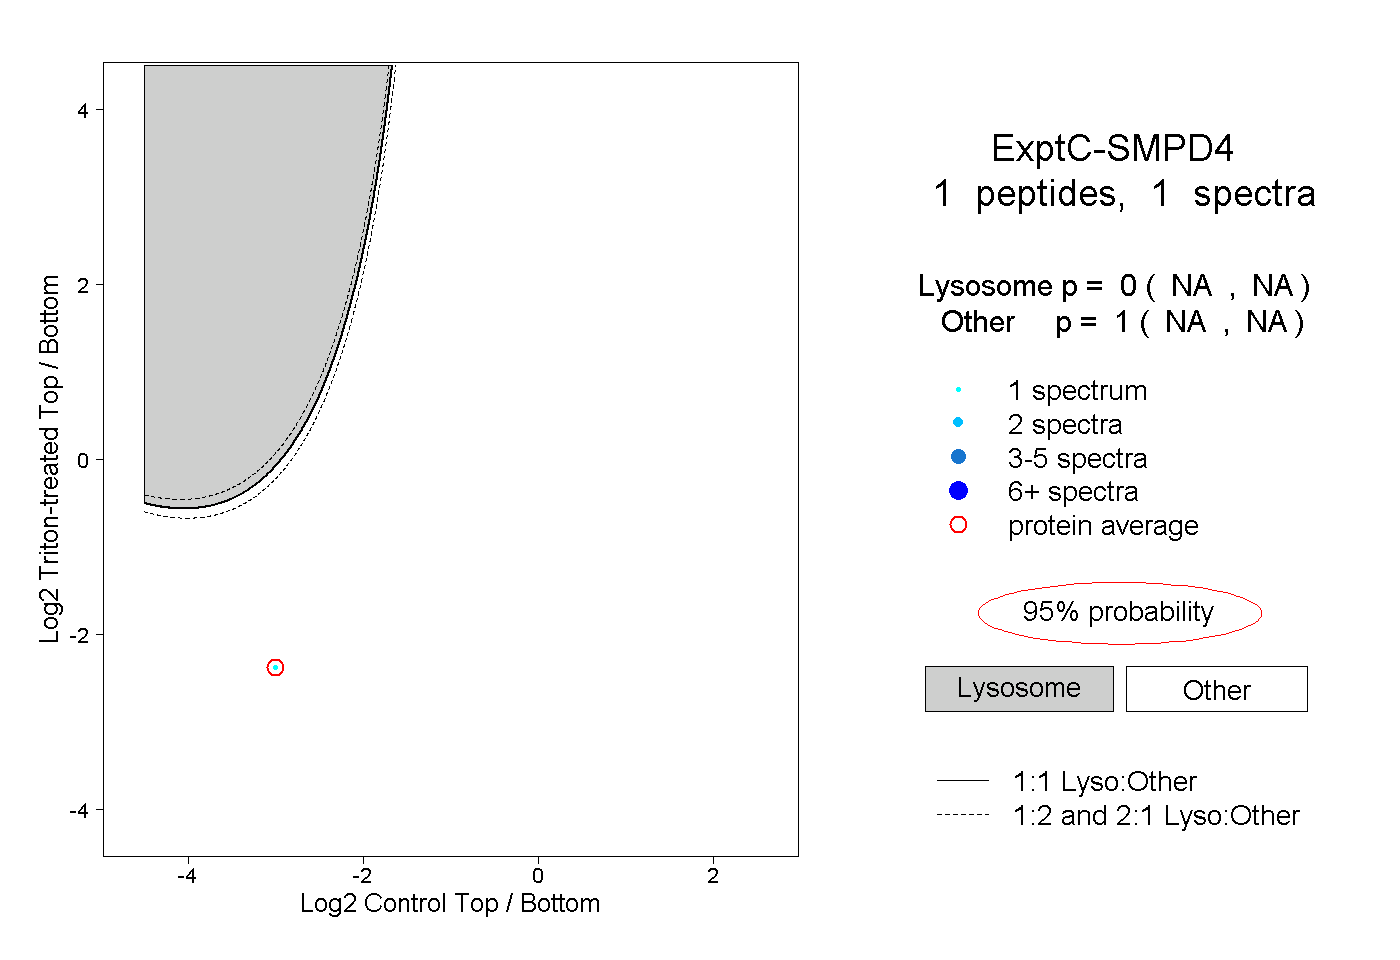 |
0.000 NA | NA |
1.000 NA | NA |