35
35peptides
spectra
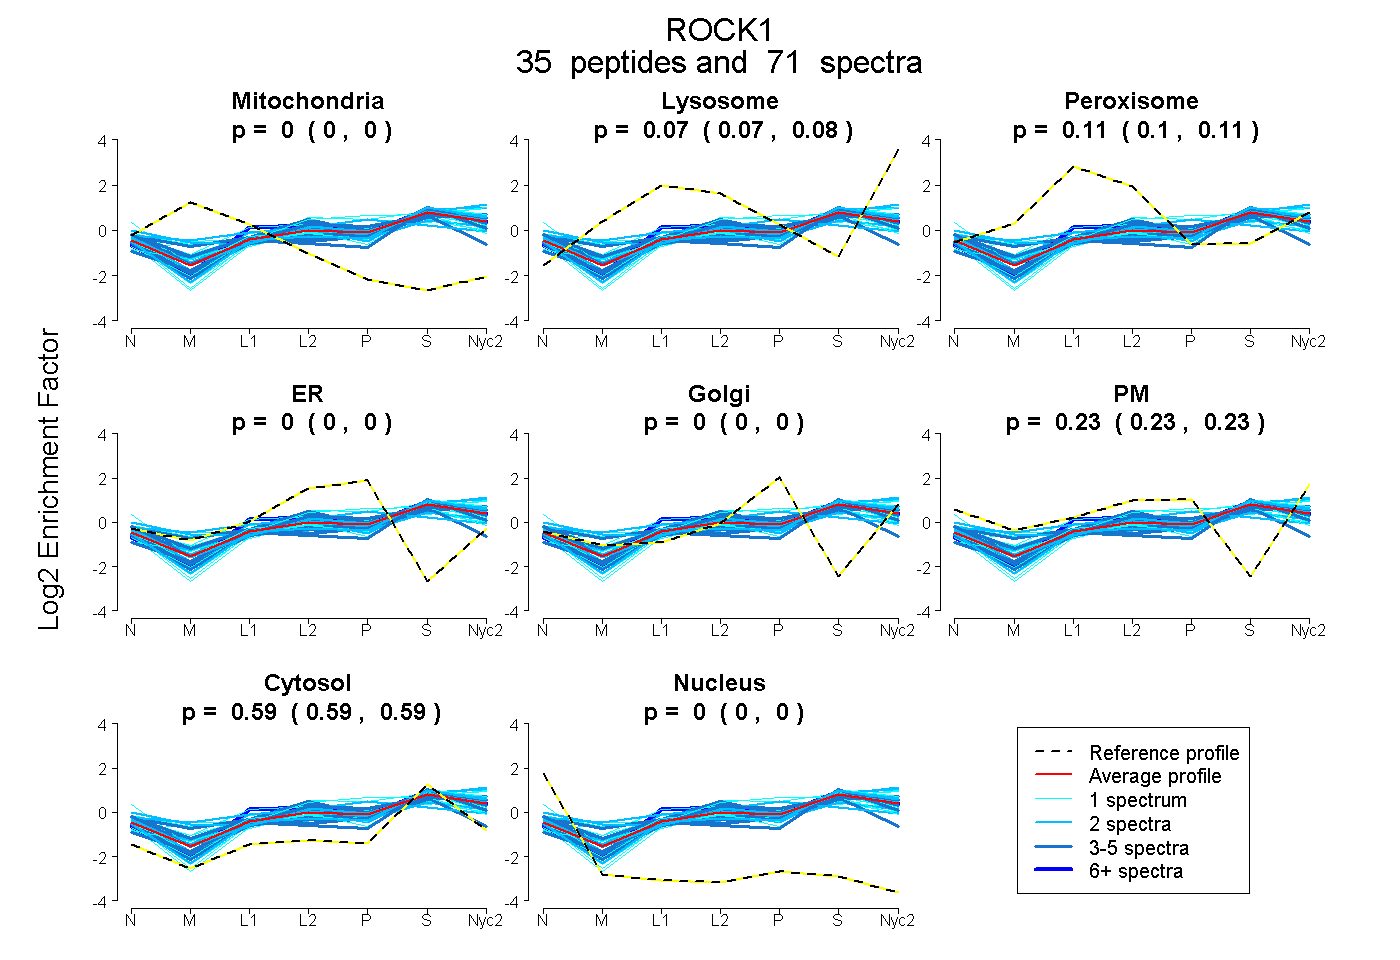
0.000 | 0.000
0.069 | 0.078
0.101 | 0.109
0.000 | 0.000
0.000 | 0.000
0.229 | 0.235
0.587 | 0.590
0.000 | 0.000
8peptides
spectra
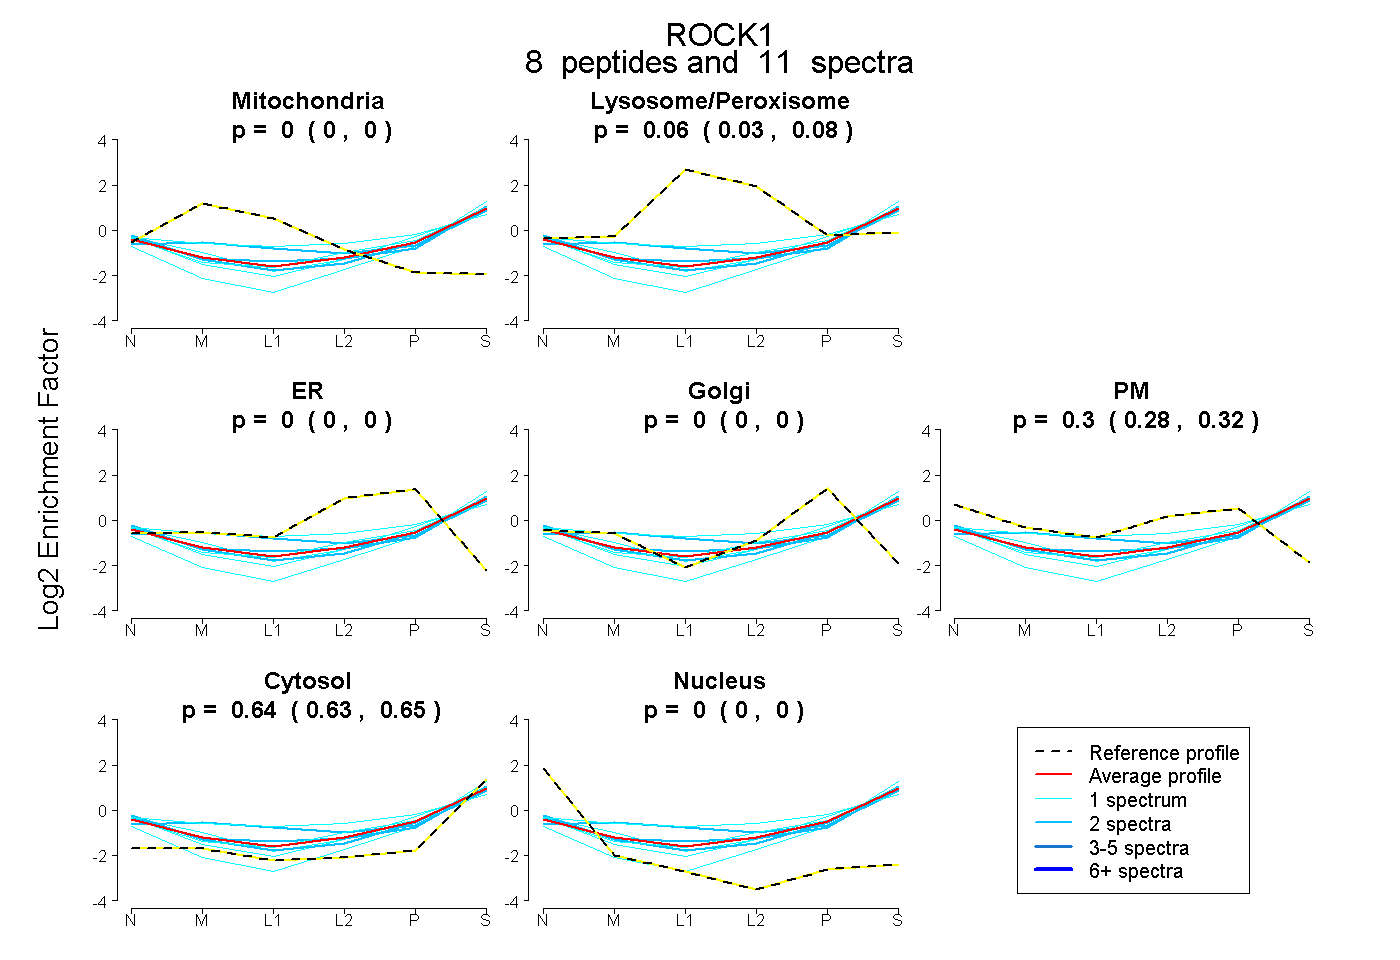
0.000 | 0.000
0.032 | 0.078
0.000 | 0.000
0.000 | 0.000
0.281 | 0.315
0.631 | 0.652
0.000 | 0.000