8
8peptides
spectra
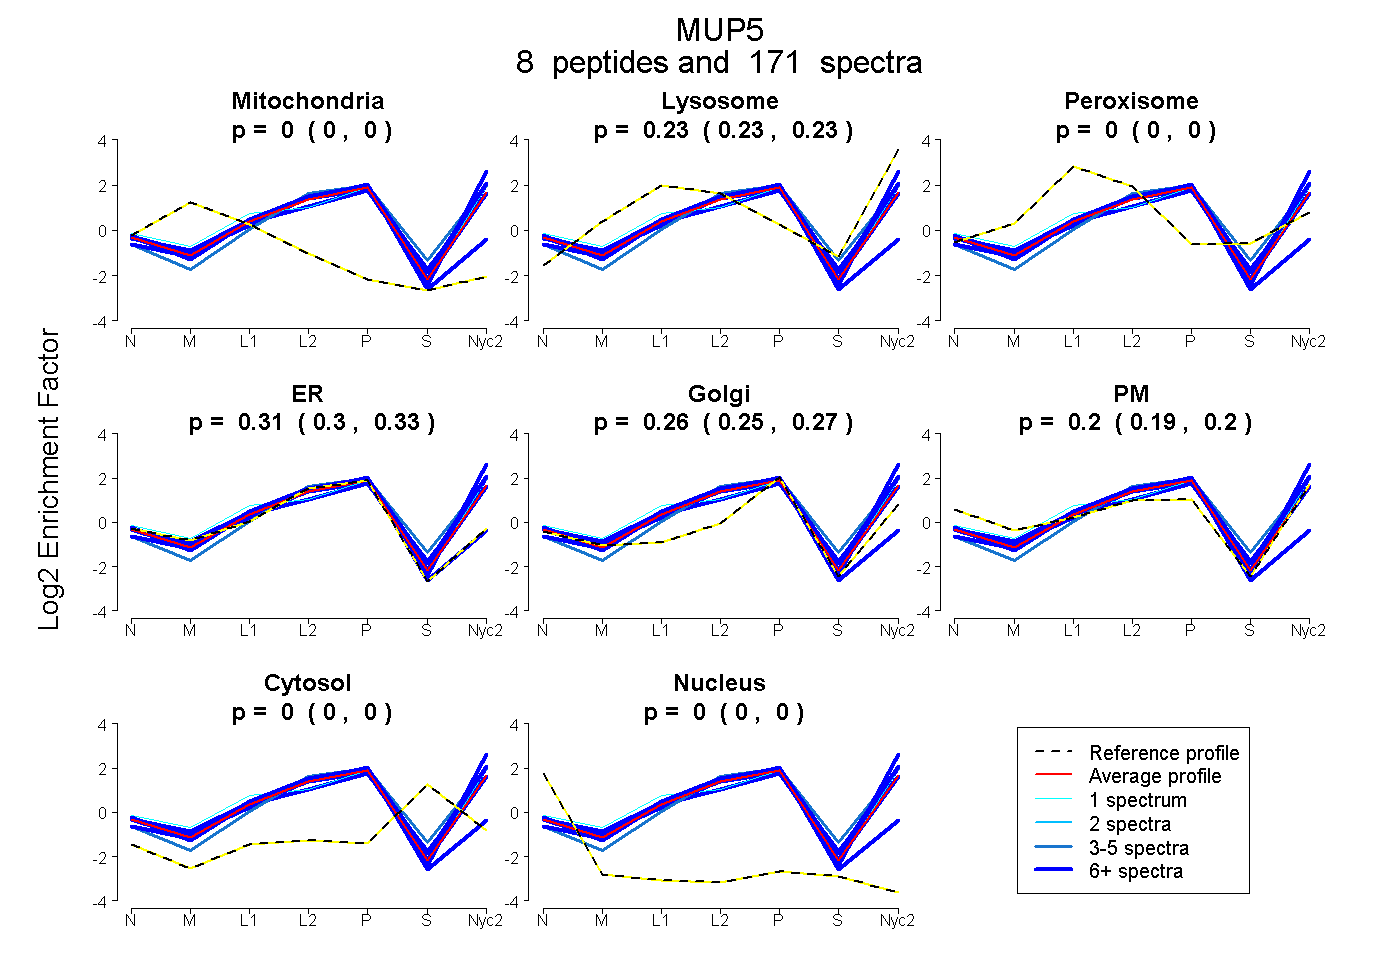
0.000 | 0.000
0.227 | 0.235
0.000 | 0.000
0.297 | 0.327
0.253 | 0.265
0.187 | 0.203
0.000 | 0.000
0.000 | 0.000
7peptides
spectra
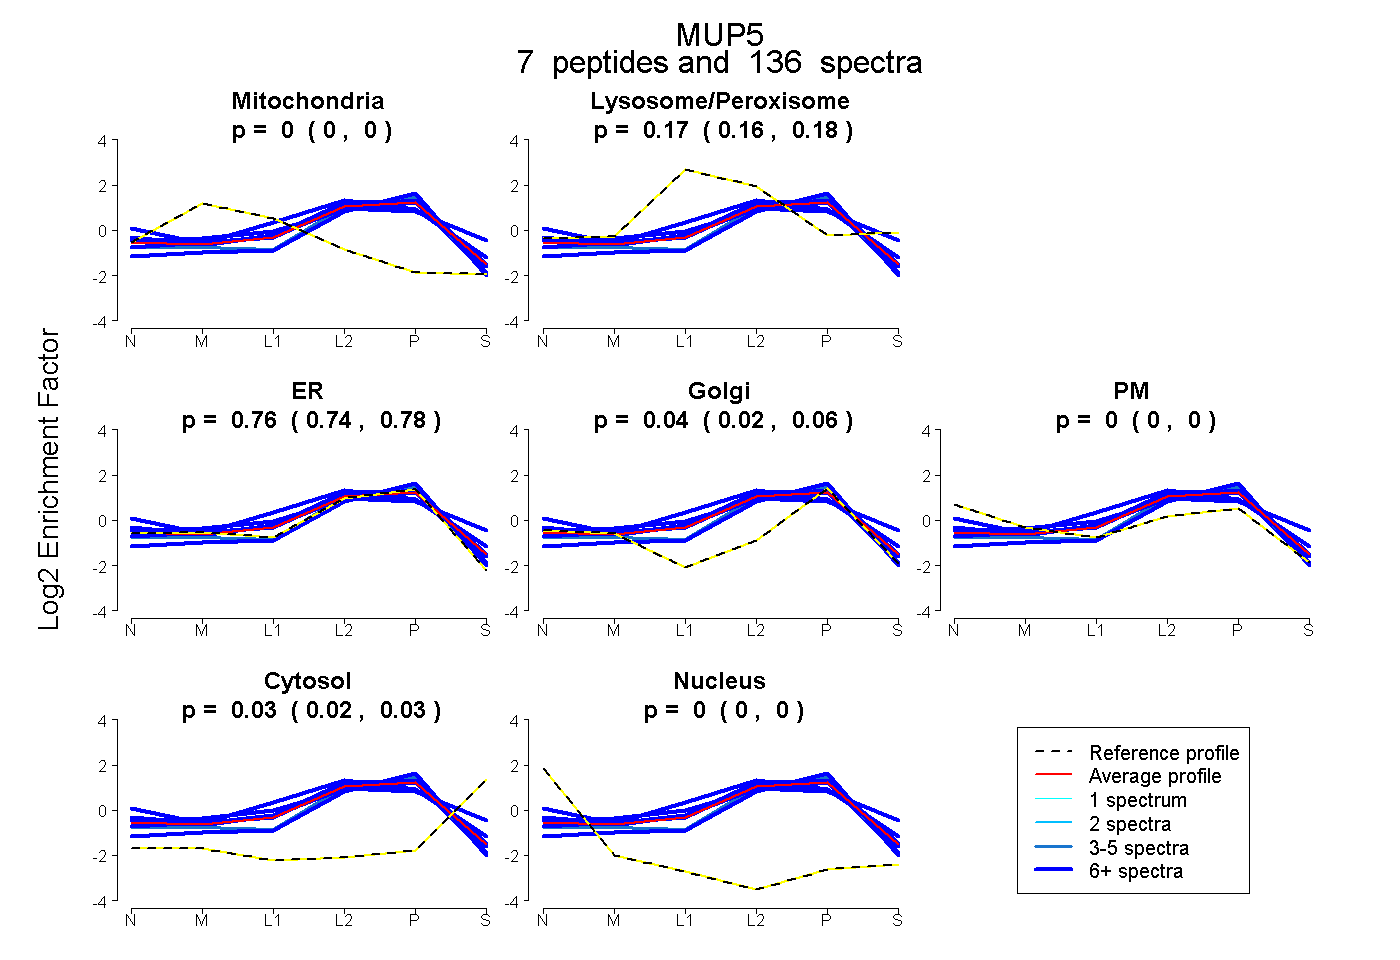
0.000 | 0.000
0.161 | 0.179
0.741 | 0.780
0.023 | 0.056
0.000 | 0.000
0.019 | 0.032
0.000 | 0.000