 8
8peptides
spectra
0.000 | 0.000
0.227 | 0.235
0.000 | 0.000
0.297 | 0.327
0.253 | 0.265
0.187 | 0.203
0.000 | 0.000
0.000 | 0.000
| Plot | Mito | Lyso | Perox | ER | Golgi | PM | Cytosol | Nucleus | |||||
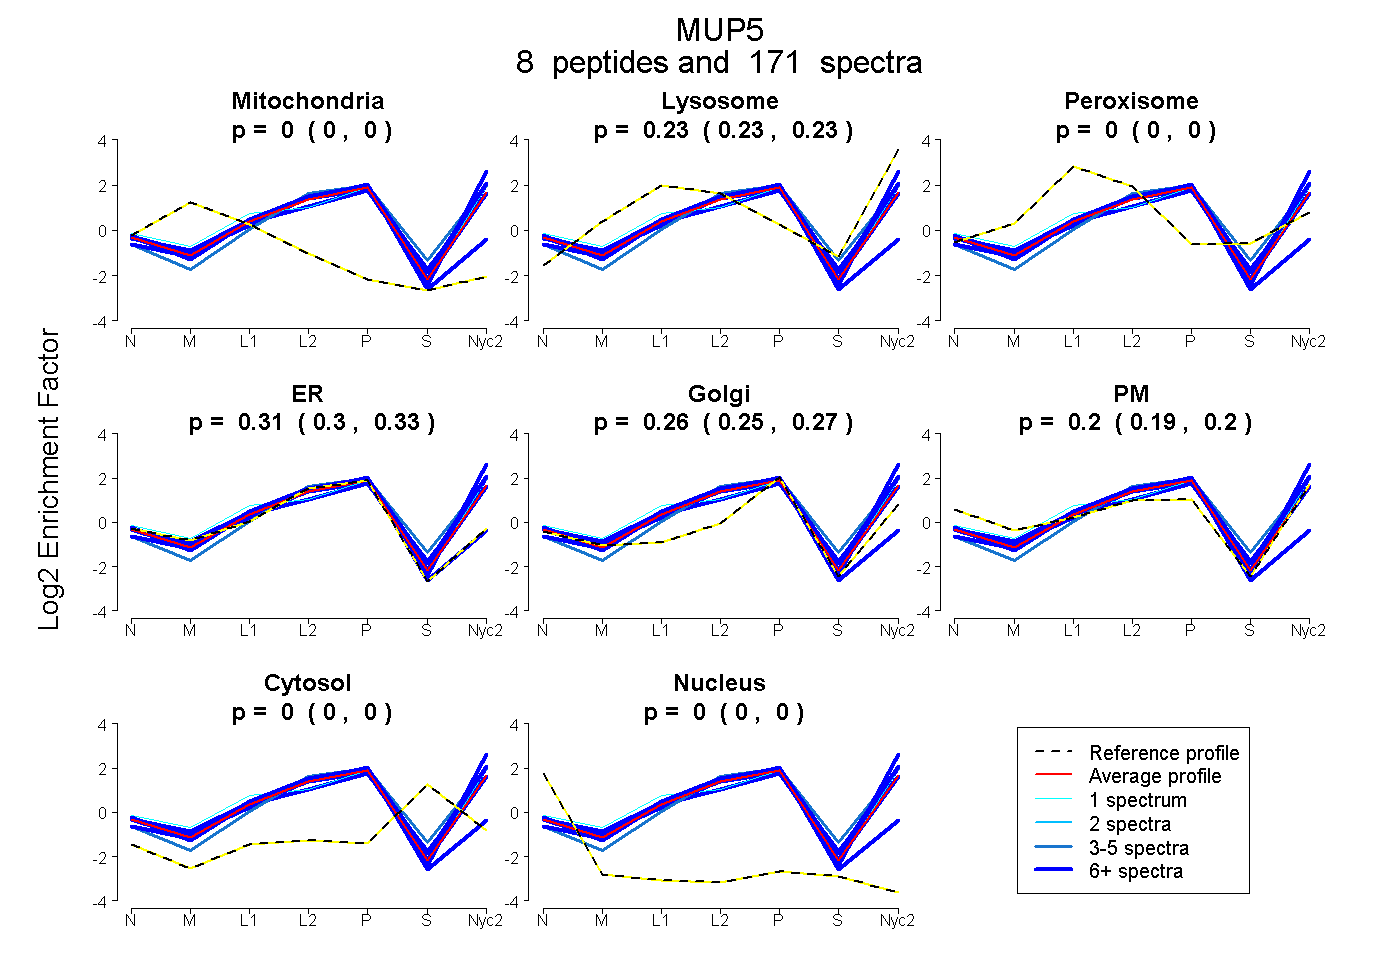
| Expt A |
8 peptides |
171 spectra |
|
0.000 0.000 | 0.000 |
0.231 0.227 | 0.235 |
0.000 0.000 | 0.000 |
0.313 0.297 | 0.327 |
0.260 0.253 | 0.265 |
0.196 0.187 | 0.203 |
0.000 0.000 | 0.000 |
0.000 0.000 | 0.000 |
| 67 spectra, DNIIDLTK | 0.000 | 0.257 | 0.000 | 0.349 | 0.197 | 0.197 | 0.000 | 0.000 | ||
| 3 spectra, LNGDWFSIVVASNK | 0.000 | 0.330 | 0.000 | 0.229 | 0.416 | 0.000 | 0.025 | 0.000 | ||
| 7 spectra, VFMQHIDVLENSLGFK | 0.000 | 0.385 | 0.000 | 0.260 | 0.351 | 0.004 | 0.000 | 0.000 | ||
| 14 spectra, ELYLVAYK | 0.000 | 0.258 | 0.000 | 0.203 | 0.378 | 0.147 | 0.014 | 0.000 | ||
| 21 spectra, IEENGSMR | 0.000 | 0.245 | 0.000 | 0.179 | 0.290 | 0.286 | 0.000 | 0.000 | ||
| 1 spectrum, TPEDGEYFVEYDGGNTFTILK | 0.000 | 0.236 | 0.000 | 0.144 | 0.229 | 0.391 | 0.000 | 0.000 | ||
| 11 spectra, YVMFHLVNFK | 0.000 | 0.259 | 0.000 | 0.011 | 0.308 | 0.422 | 0.000 | 0.000 | ||
| 47 spectra, LCEAHGITR | 0.000 | 0.000 | 0.000 | 0.985 | 0.000 | 0.000 | 0.015 | 0.000 |
| Plot | Mito | Lyso or Perox | ER | Golgi | PM | Cytosol | Nucleus | ||||||
| Expt B |
7 peptides |
136 spectra |
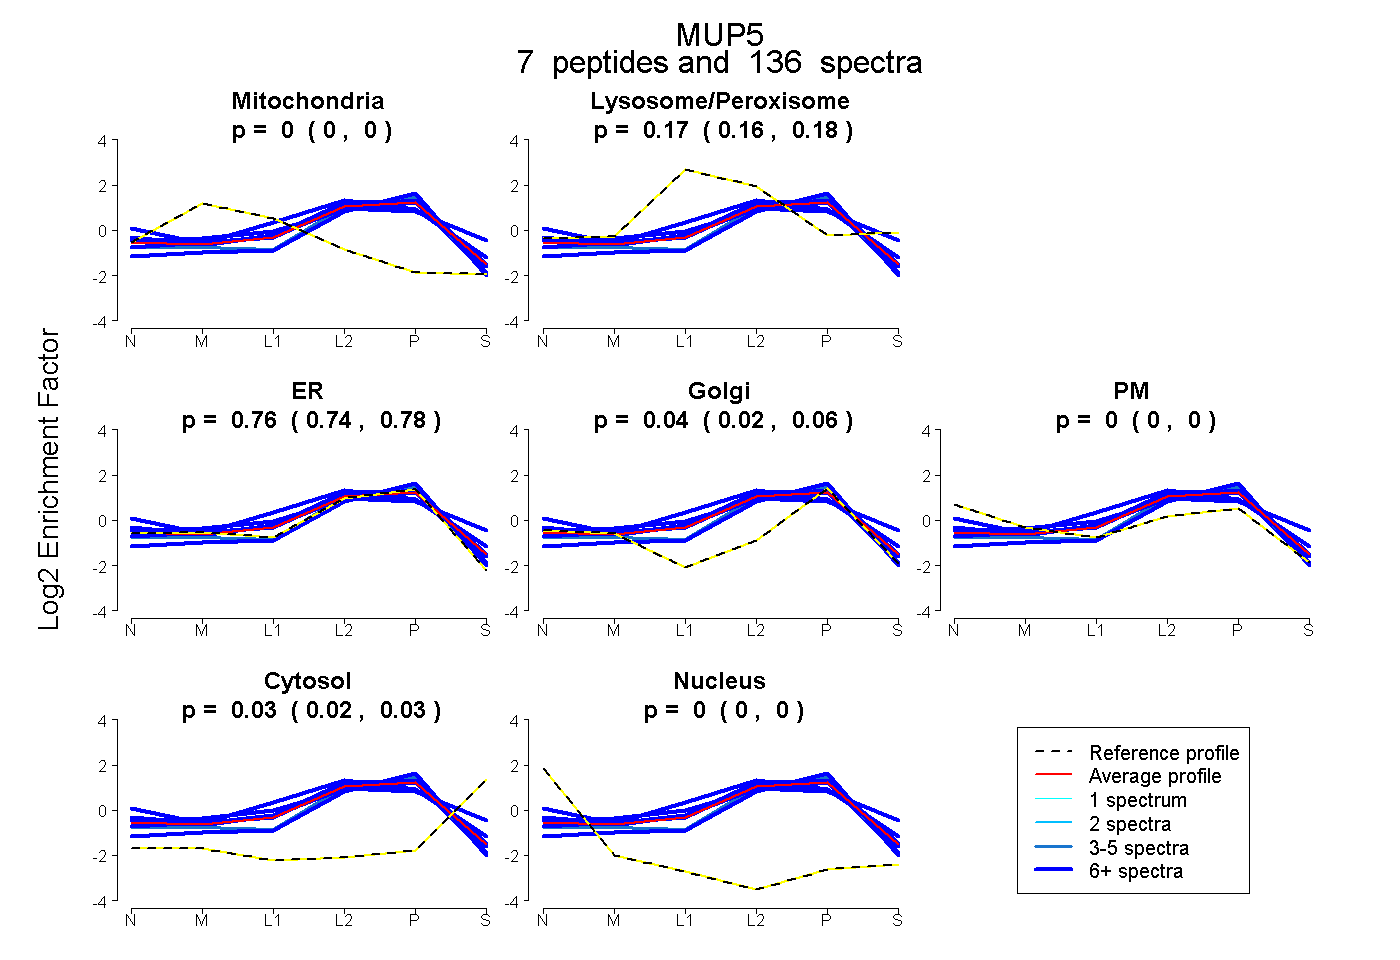 |
0.000 0.000 | 0.000 |
0.171 0.161 | 0.179 |
0.762 0.741 | 0.780 |
0.041 0.023 | 0.056 |
0.000 0.000 | 0.000 |
0.026 0.019 | 0.032 |
0.000 0.000 | 0.000 |
|||
| Plot | Lyso | Other | |||||||||||
| Expt C |
7 peptides |
287 spectra |
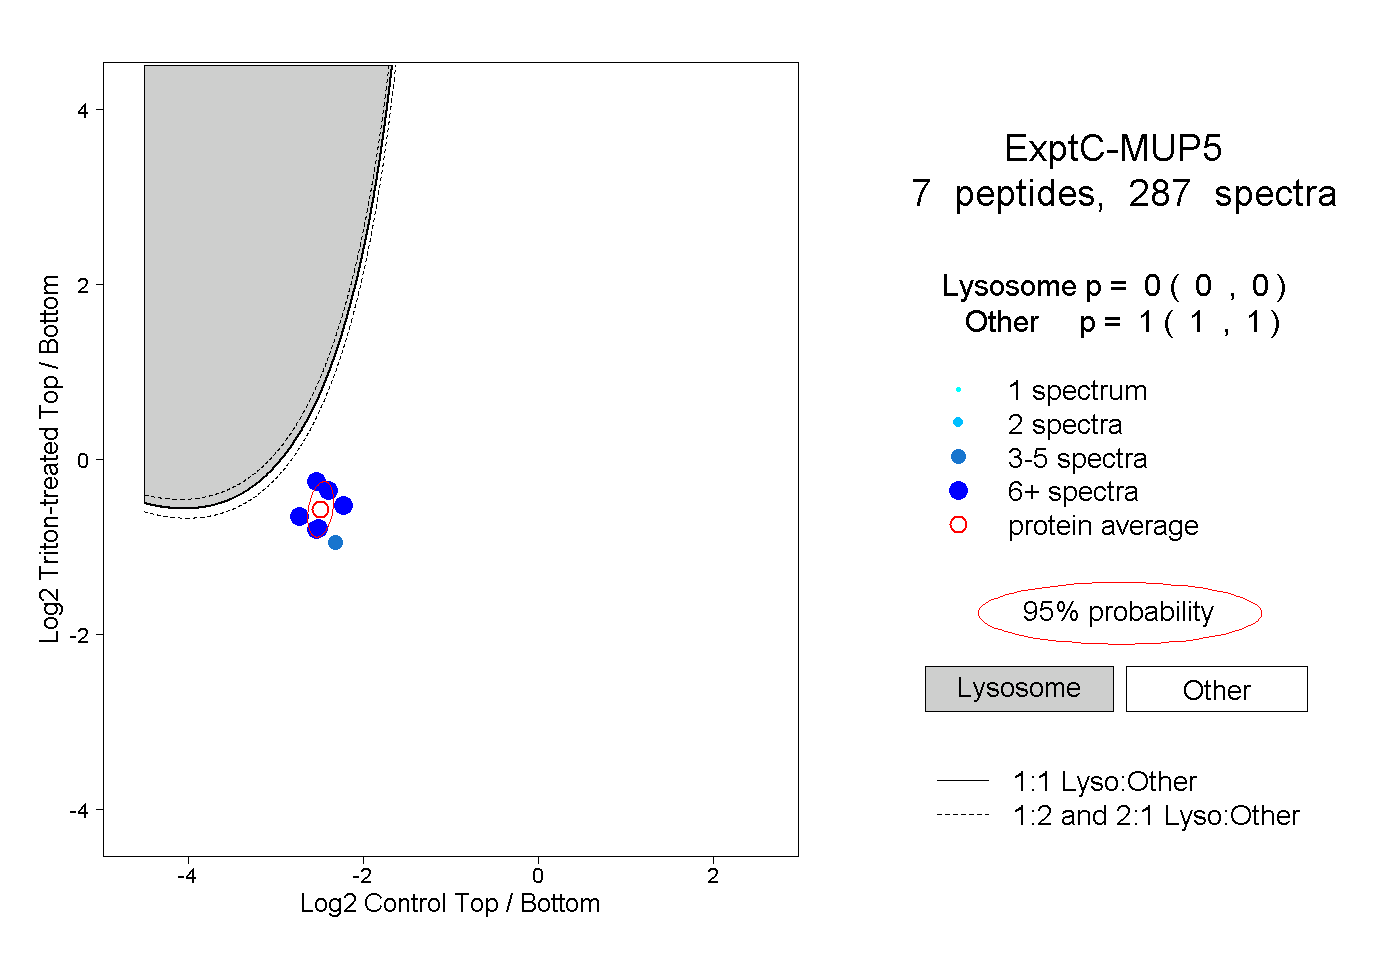 |
0.000 0.000 | 0.000 |
1.000 1.000 | 1.000 |
||||||||
| Plot | Lyso | Other | |||||||||||
| Expt D |
5 peptides |
22 spectra |
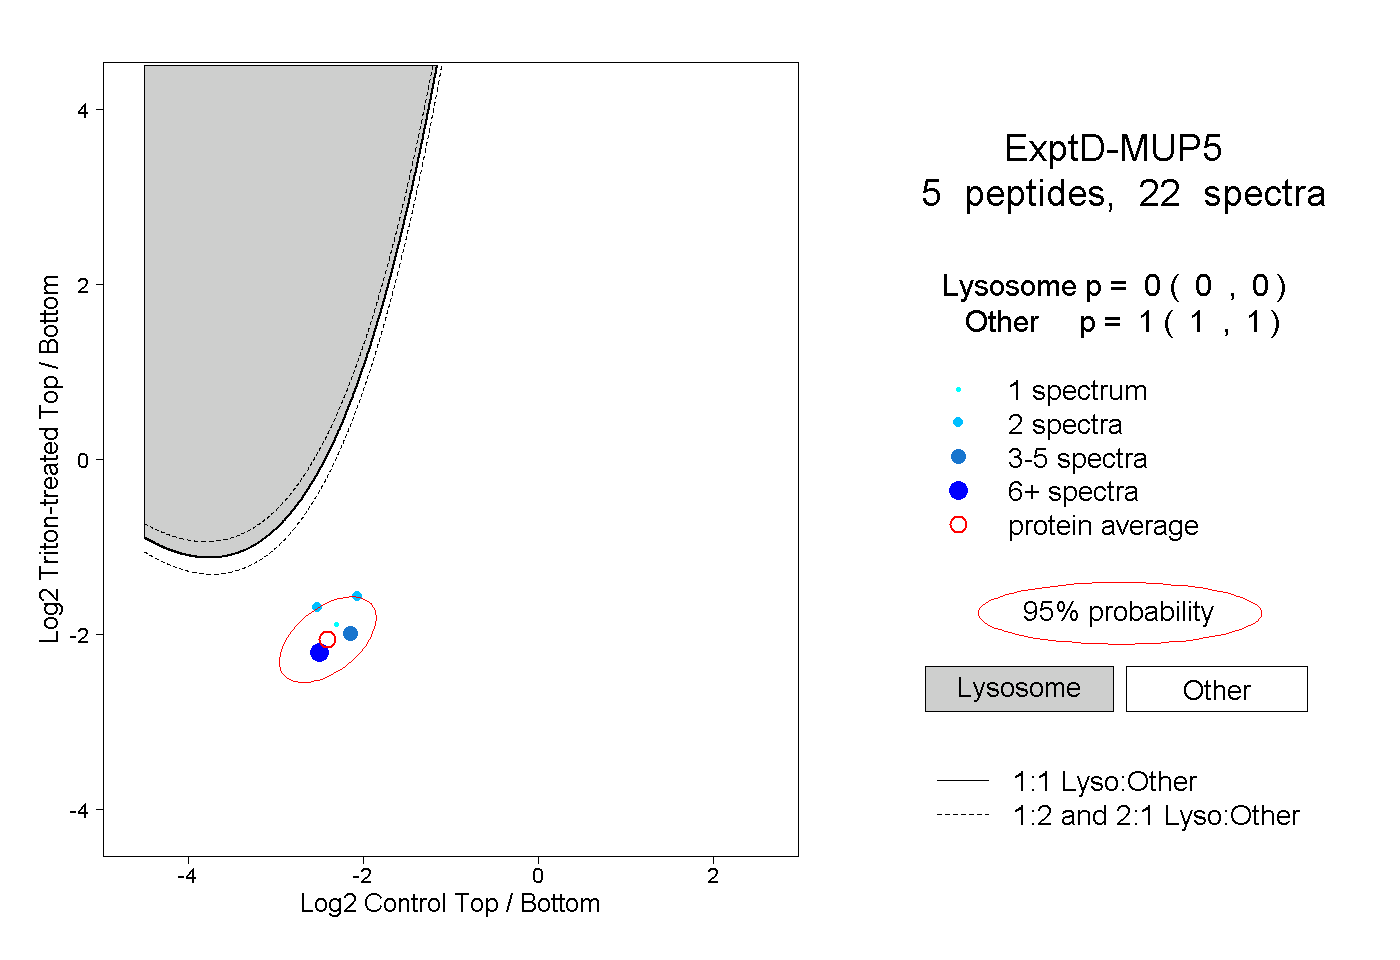 |
0.000 0.000 | 0.000 |
1.000 1.000 | 1.000 |