 7
7peptides
spectra
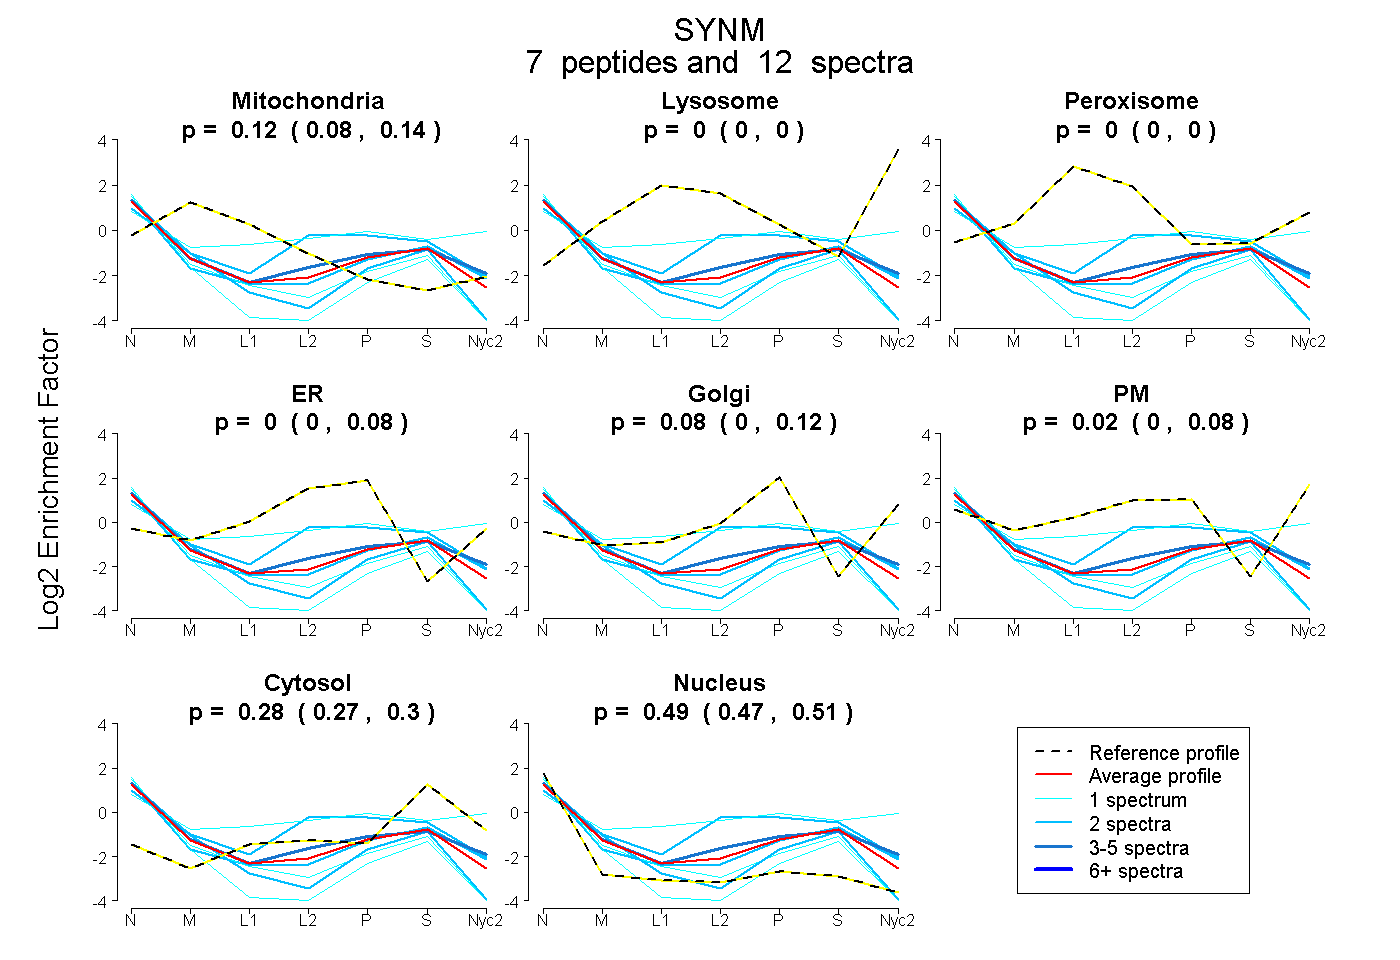
0.084 | 0.141
0.000 | 0.000
0.000 | 0.000
0.000 | 0.079
0.000 | 0.117
0.000 | 0.085
0.267 | 0.297
0.475 | 0.513
| Plot | Mito | Lyso | Perox | ER | Golgi | PM | Cytosol | Nucleus | |||||
| Expt A |
7 peptides |
12 spectra |
|
0.123 0.084 | 0.141 |
0.000 0.000 | 0.000 |
0.000 0.000 | 0.000 |
0.000 0.000 | 0.079 |
0.084 0.000 | 0.117 |
0.018 0.000 | 0.085 |
0.283 0.267 | 0.297 |
0.492 0.475 | 0.513 |
| 1 spectrum, ELEEALGAR | 0.121 | 0.000 | 0.000 | 0.000 | 0.000 | 0.000 | 0.170 | 0.708 | ||
| 2 spectra, ESMQLYEDEVR | 0.122 | 0.000 | 0.000 | 0.000 | 0.000 | 0.000 | 0.184 | 0.694 | ||
| 2 spectra, AALEALLGR | 0.000 | 0.000 | 0.000 | 0.000 | 0.000 | 0.129 | 0.330 | 0.541 | ||
| 1 spectrum, SVASDEK | 0.000 | 0.000 | 0.091 | 0.000 | 0.000 | 0.454 | 0.325 | 0.130 | ||
| 3 spectra, LQAEDEAR | 0.046 | 0.000 | 0.000 | 0.000 | 0.000 | 0.210 | 0.279 | 0.465 | ||
| 1 spectrum, ENLLLEEELR | 0.000 | 0.000 | 0.000 | 0.000 | 0.000 | 0.000 | 0.093 | 0.907 | ||
| 2 spectra, DLDAAHER | 0.031 | 0.000 | 0.000 | 0.369 | 0.000 | 0.000 | 0.312 | 0.288 |
| Plot | Lyso | Other | |||||||||||
| Expt C |
2 peptides |
6 spectra |
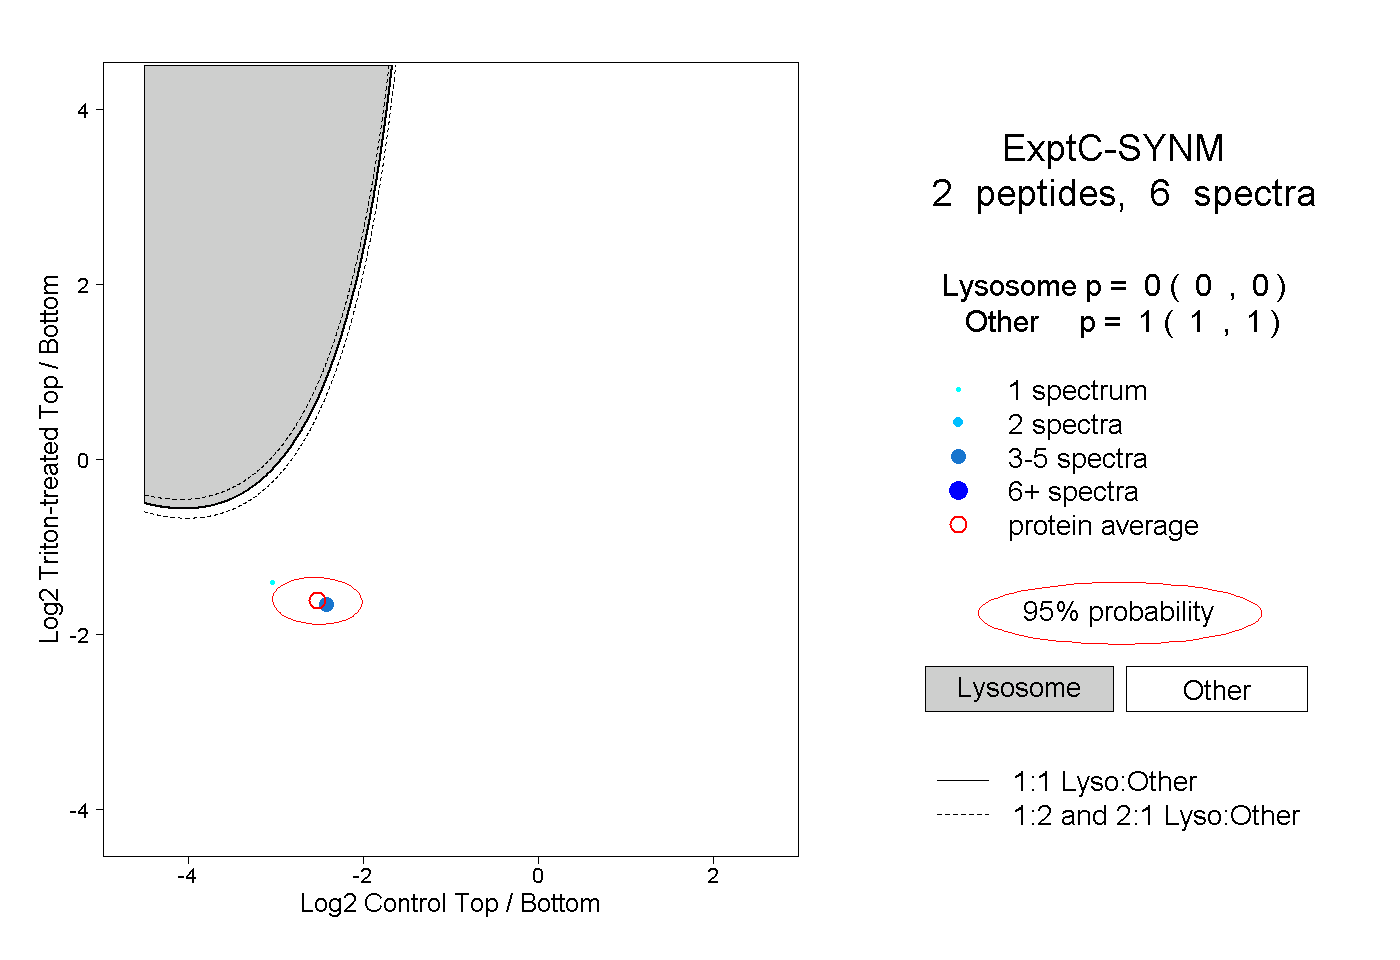 |
0.000 0.000 | 0.000 |
1.000 1.000 | 1.000 |