 2
2peptides
spectra
0.000 | 0.000
0.000 | 0.028
0.000 | 0.000
0.000 | 0.000
0.074 | 0.112
0.000 | 0.000
0.876 | 0.918
0.000 | 0.000
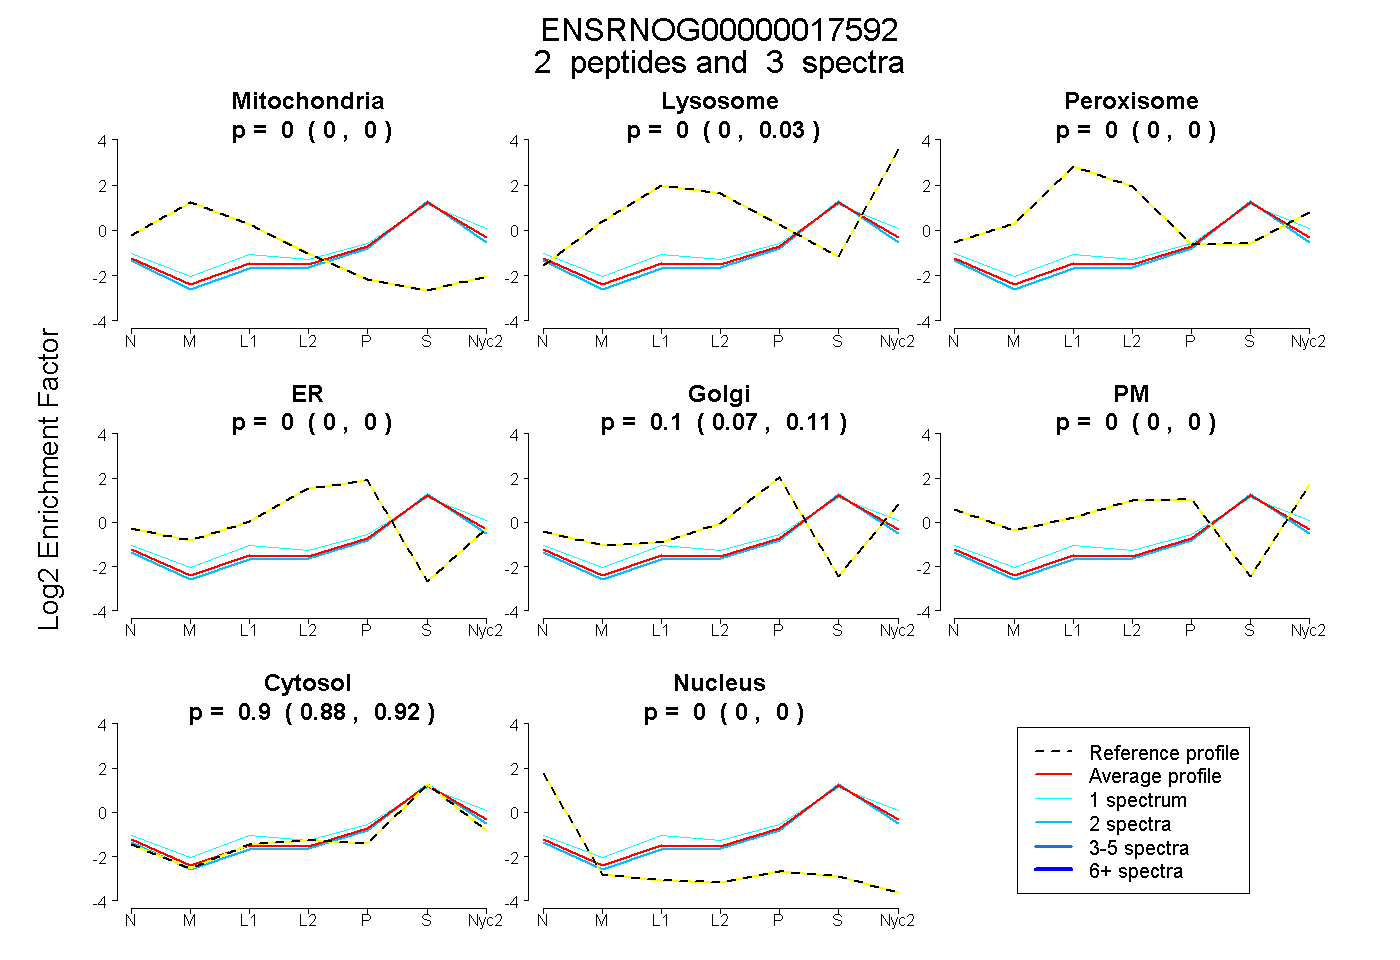
| Plot | Mito | Lyso | Perox | ER | Golgi | PM | Cytosol | Nucleus | |||||
| Expt A |
2 peptides |
3 spectra |
|
0.000 0.000 | 0.000 |
0.000 0.000 | 0.028 |
0.000 0.000 | 0.000 |
0.000 0.000 | 0.000 |
0.100 0.074 | 0.112 |
0.000 0.000 | 0.000 |
0.900 0.876 | 0.918 |
0.000 0.000 | 0.000 |
| 2 spectra, LLVLQR | 0.000 | 0.000 | 0.000 | 0.000 | 0.057 | 0.000 | 0.943 | 0.000 | ||
| 1 spectrum, GVTIPNSGADTLGR | 0.000 | 0.098 | 0.000 | 0.000 | 0.091 | 0.000 | 0.810 | 0.000 |