 5
5peptides
spectra
0.000 | 0.000
0.000 | 0.000
0.000 | 0.000
0.107 | 0.138
0.000 | 0.000
0.000 | 0.000
0.804 | 0.832
0.039 | 0.070
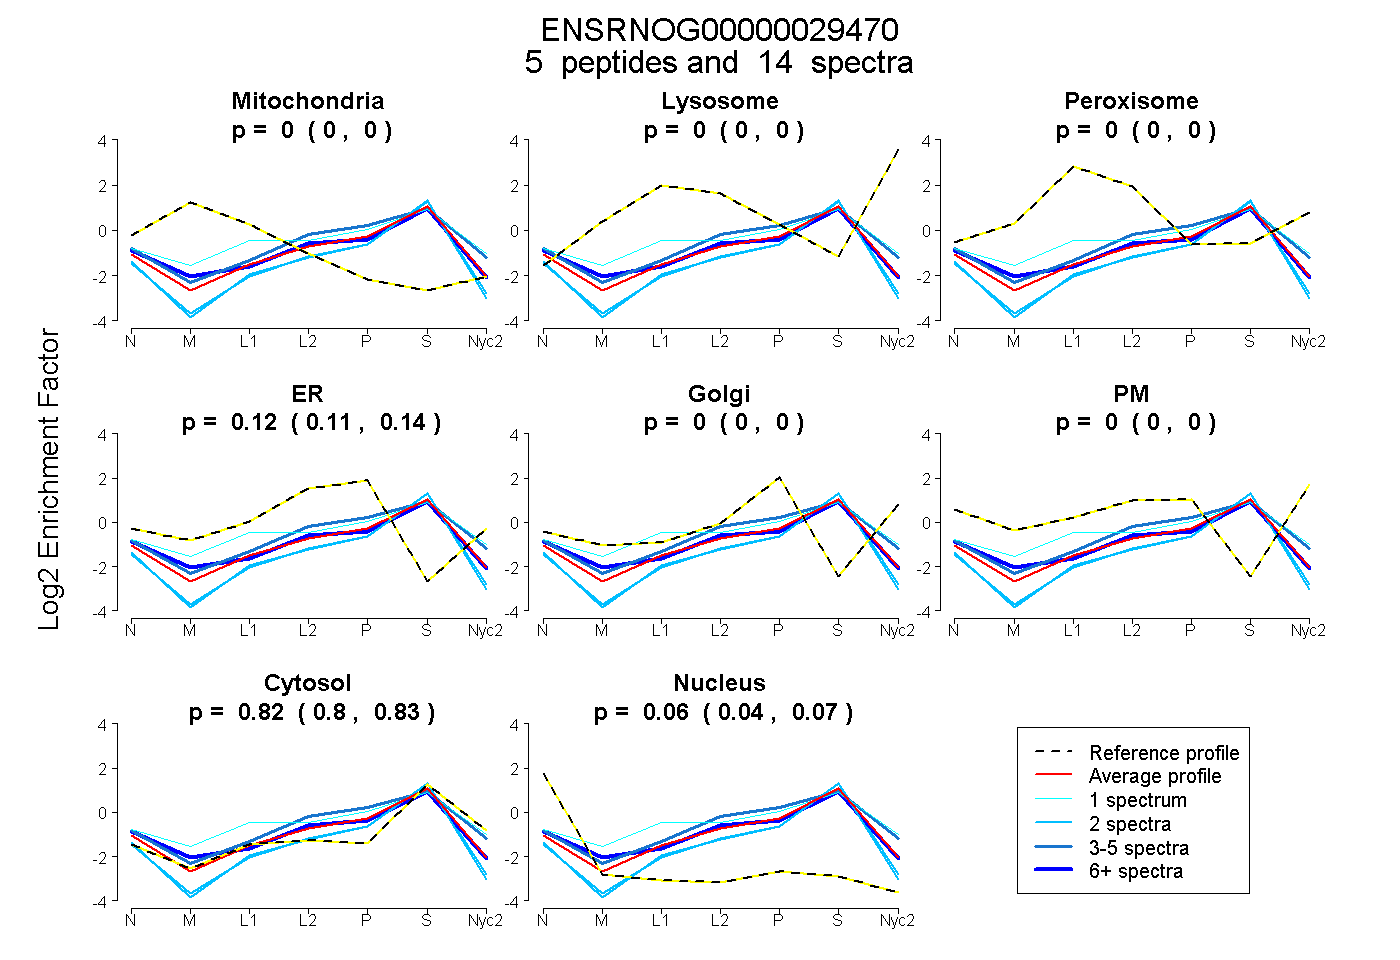
| Plot | Mito | Lyso | Perox | ER | Golgi | PM | Cytosol | Nucleus | |||||
| Expt A |
5 peptides |
14 spectra |
|
0.000 0.000 | 0.000 |
0.000 0.000 | 0.000 |
0.000 0.000 | 0.000 |
0.124 0.107 | 0.138 |
0.000 0.000 | 0.000 |
0.000 0.000 | 0.000 |
0.820 0.804 | 0.832 |
0.056 0.039 | 0.070 |
| 3 spectra, IGQVLAR | 0.000 | 0.000 | 0.000 | 0.258 | 0.000 | 0.000 | 0.742 | 0.000 | ||
| 6 spectra, HPELEAR | 0.000 | 0.000 | 0.000 | 0.159 | 0.000 | 0.000 | 0.768 | 0.073 | ||
| 2 spectra, GVDLYVLEK | 0.000 | 0.000 | 0.000 | 0.000 | 0.000 | 0.000 | 0.868 | 0.132 | ||
| 1 spectrum, TVQEAR | 0.000 | 0.000 | 0.112 | 0.207 | 0.000 | 0.000 | 0.681 | 0.000 | ||
| 2 spectra, QDPQCLLDLAR | 0.000 | 0.000 | 0.000 | 0.000 | 0.000 | 0.000 | 0.862 | 0.138 |
| Plot | Mito | Lyso or Perox | ER | Golgi | PM | Cytosol | Nucleus | ||||||
| Expt B |
1 peptide |
1 spectrum |
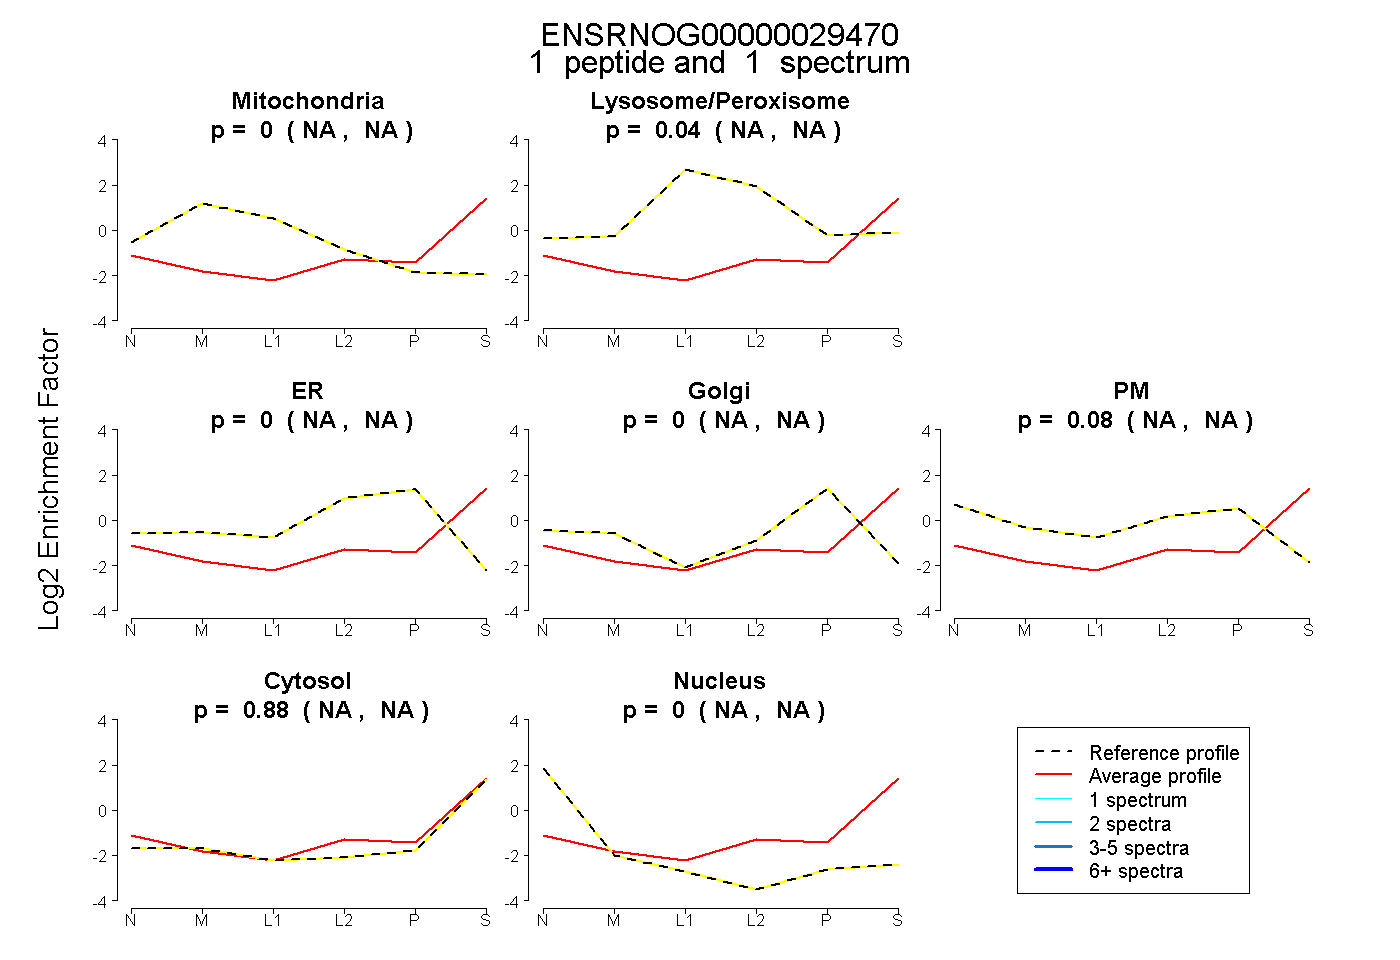 |
0.000 NA | NA |
0.036 NA | NA |
0.000 NA | NA |
0.000 NA | NA |
0.085 NA | NA |
0.879 NA | NA |
0.000 NA | NA |