 1
1peptide
spectrum
NA | NA
NA | NA
NA | NA
NA | NA
NA | NA
NA | NA
NA | NA
NA | NA
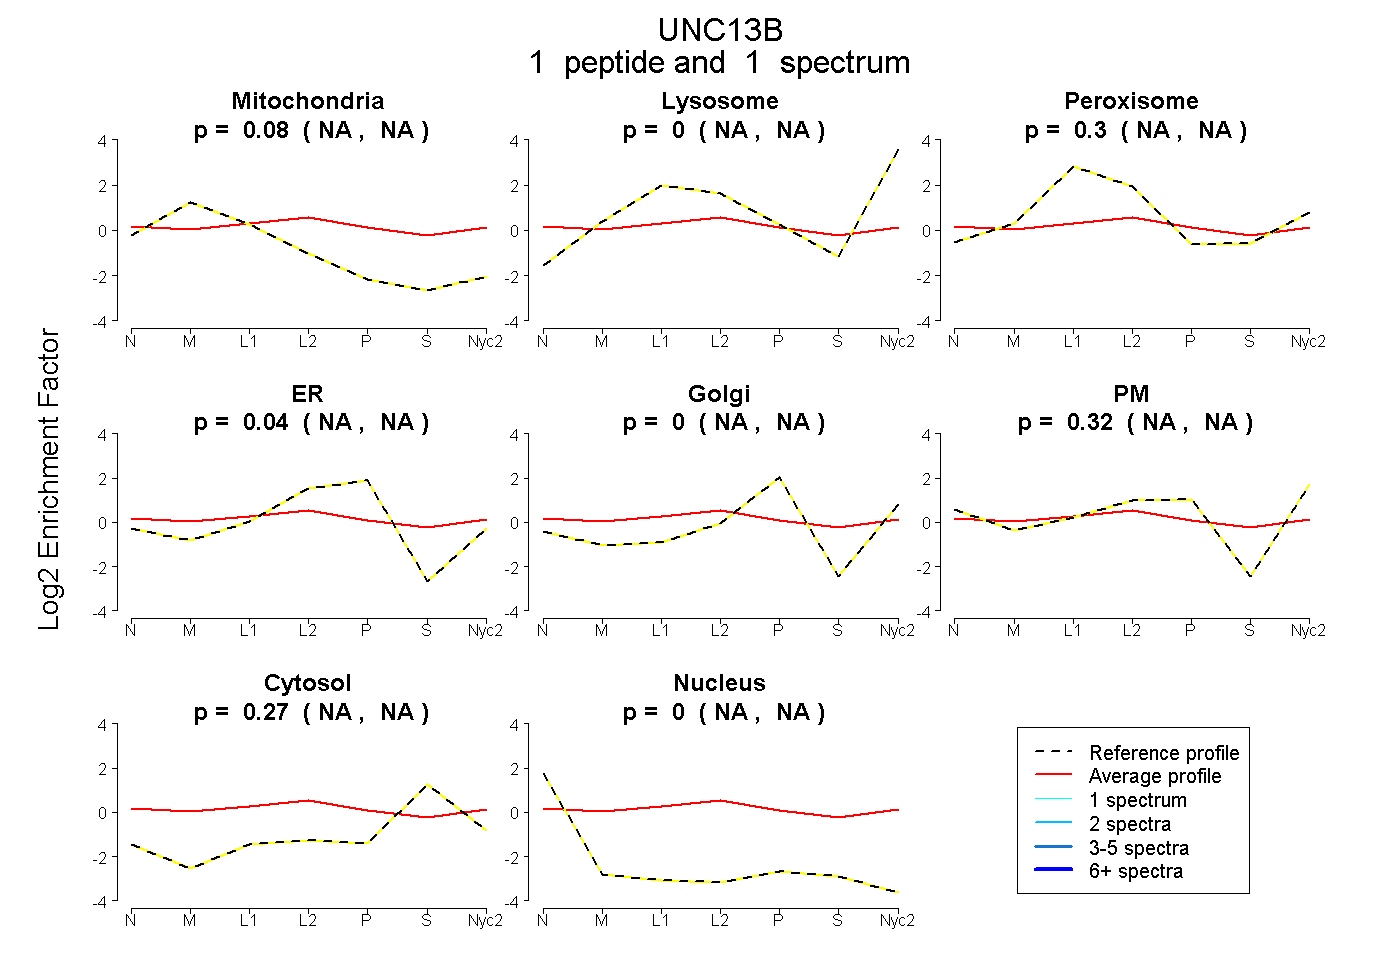
| Plot | Mito | Lyso | Perox | ER | Golgi | PM | Cytosol | Nucleus | |||||
| Expt A |
1 peptide |
1 spectrum |
|
0.080 NA | NA |
0.000 NA | NA |
0.296 NA | NA |
0.037 NA | NA |
0.000 NA | NA |
0.322 NA | NA |
0.266 NA | NA |
0.000 NA | NA |