 6
6peptides
spectra
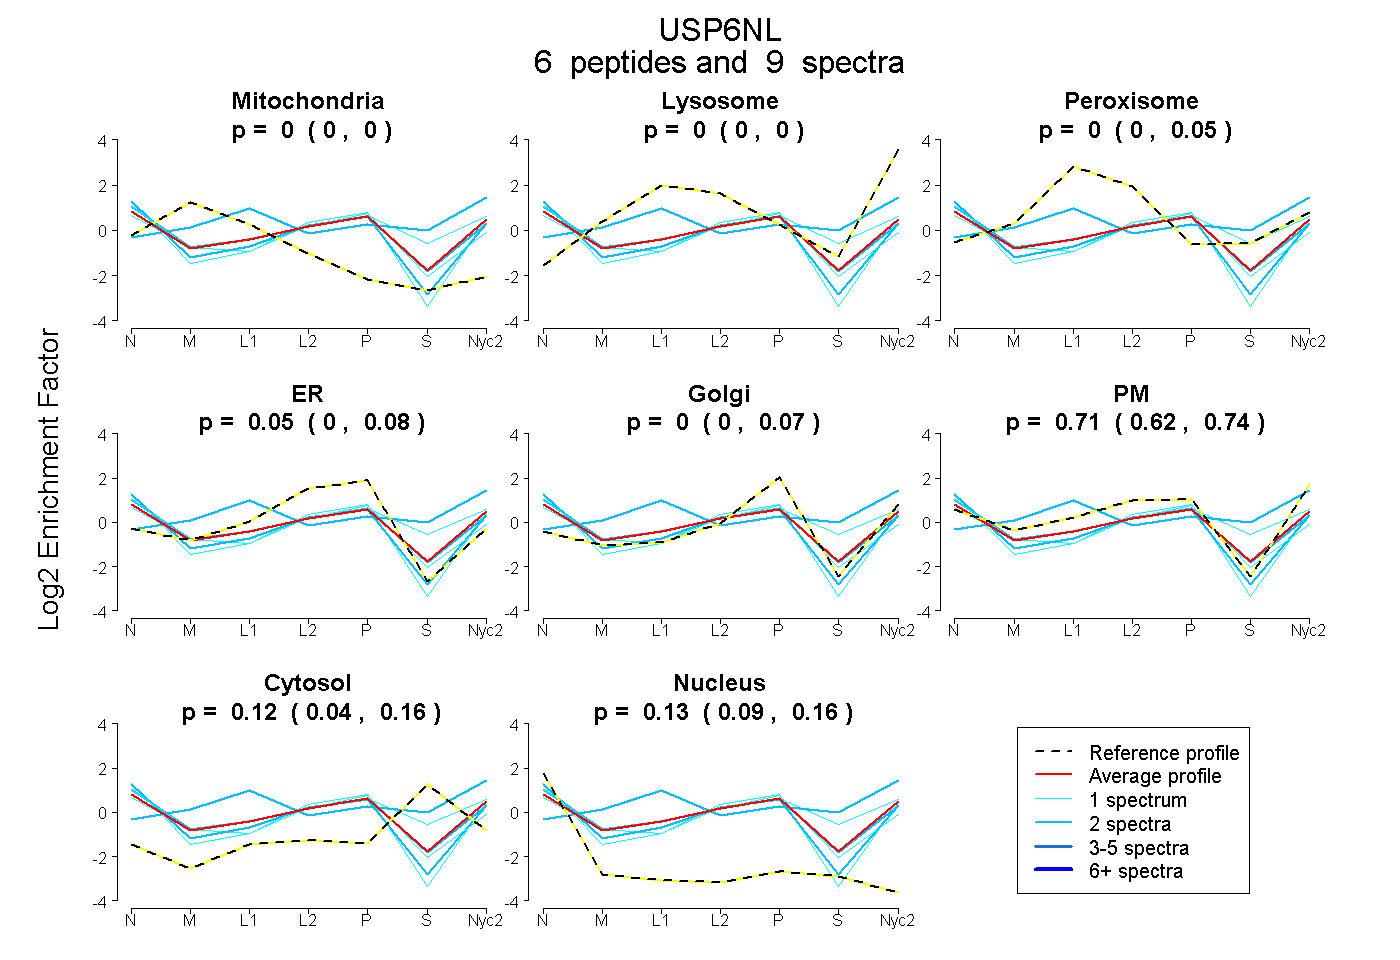
0.000 | 0.000
0.000 | 0.000
0.000 | 0.046
0.000 | 0.085
0.000 | 0.074
0.623 | 0.745
0.036 | 0.163
0.094 | 0.157
| Plot | Mito | Lyso | Perox | ER | Golgi | PM | Cytosol | Nucleus | |||||
| Expt A |
6 peptides |
9 spectra |
|
0.000 0.000 | 0.000 |
0.000 0.000 | 0.000 |
0.000 0.000 | 0.046 |
0.048 0.000 | 0.085 |
0.000 0.000 | 0.074 |
0.710 0.623 | 0.745 |
0.115 0.036 | 0.163 |
0.127 0.094 | 0.157 |
| 2 spectra, FQEHHEK | 0.000 | 0.000 | 0.021 | 0.078 | 0.000 | 0.668 | 0.068 | 0.164 | ||
| 2 spectra, YAIEGR | 0.034 | 0.320 | 0.169 | 0.000 | 0.003 | 0.202 | 0.273 | 0.000 | ||
| 1 spectrum, SVGRPSPK | 0.000 | 0.000 | 0.034 | 0.235 | 0.000 | 0.514 | 0.015 | 0.202 | ||
| 1 spectrum, IEVLPIDIGAR | 0.000 | 0.000 | 0.000 | 0.110 | 0.073 | 0.604 | 0.000 | 0.213 | ||
| 2 spectra, LTPVLPSSR | 0.000 | 0.000 | 0.000 | 0.106 | 0.000 | 0.665 | 0.000 | 0.229 | ||
| 1 spectrum, EGAEIEPWEDADYLVYK | 0.000 | 0.000 | 0.000 | 0.000 | 0.035 | 0.613 | 0.332 | 0.020 |
| Plot | Lyso | Other | |||||||||||
| Expt C |
7 peptides |
11 spectra |
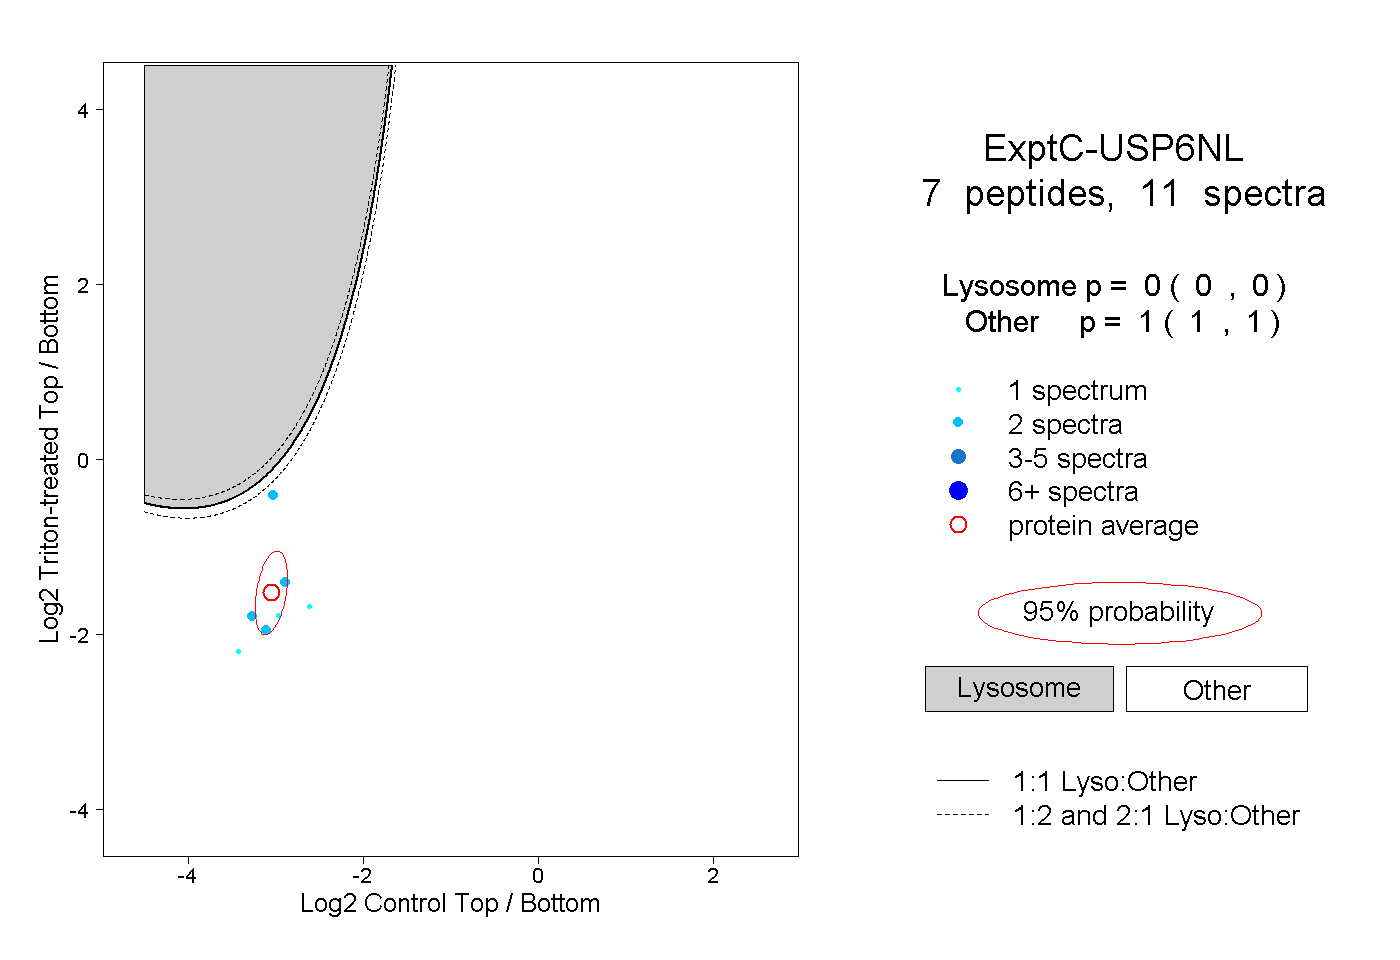 |
0.000 0.000 | 0.000 |
1.000 1.000 | 1.000 |