7
7peptides
spectra
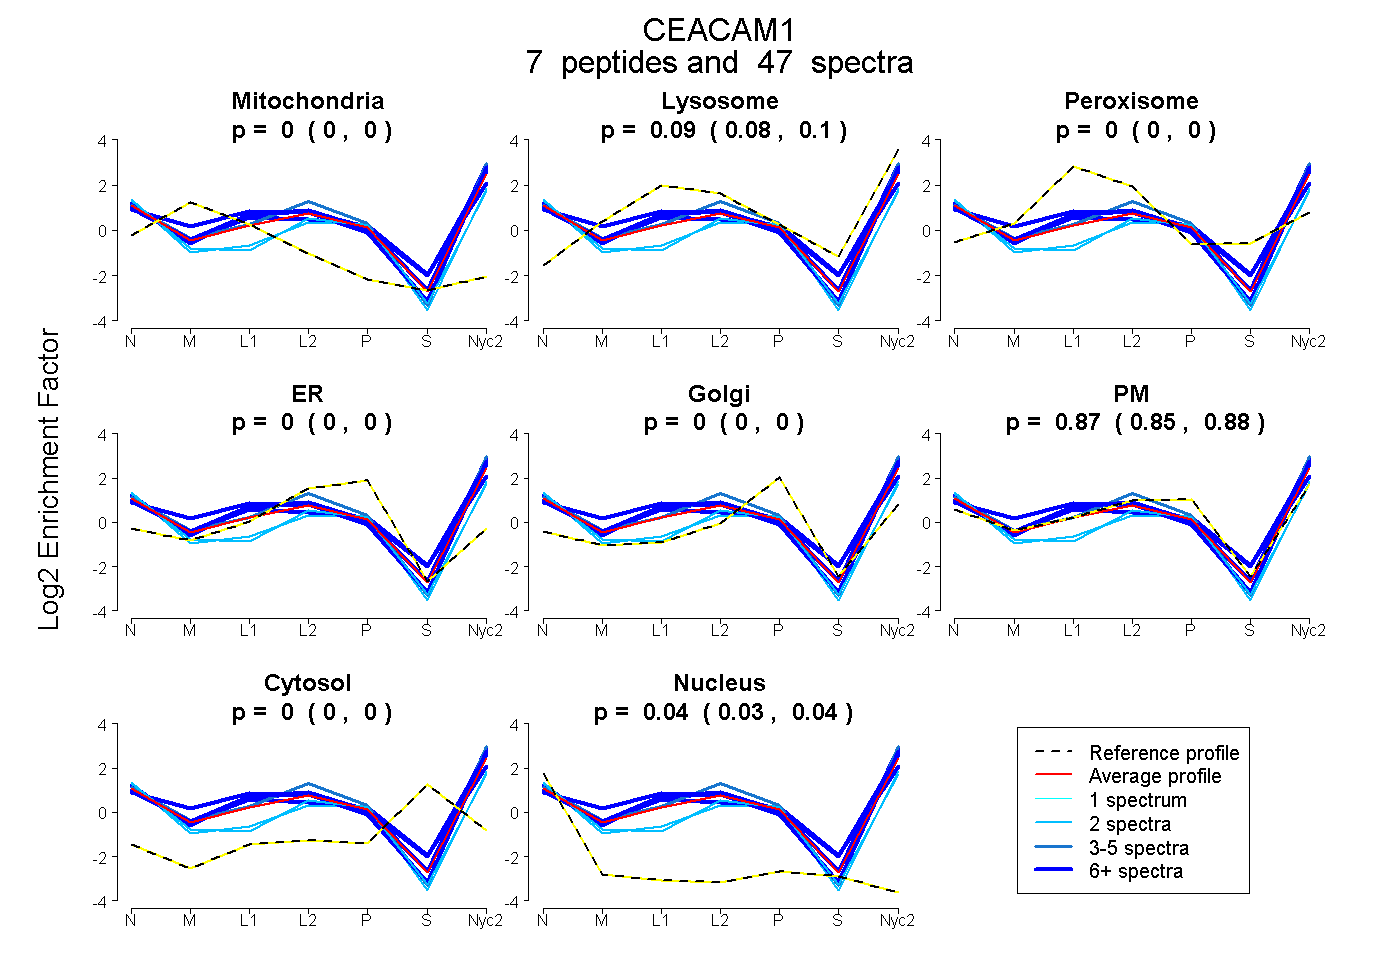
0.000 | 0.000
0.080 | 0.104
0.000 | 0.000
0.000 | 0.000
0.000 | 0.000
0.853 | 0.880
0.000 | 0.000
0.035 | 0.043
5peptides
spectra
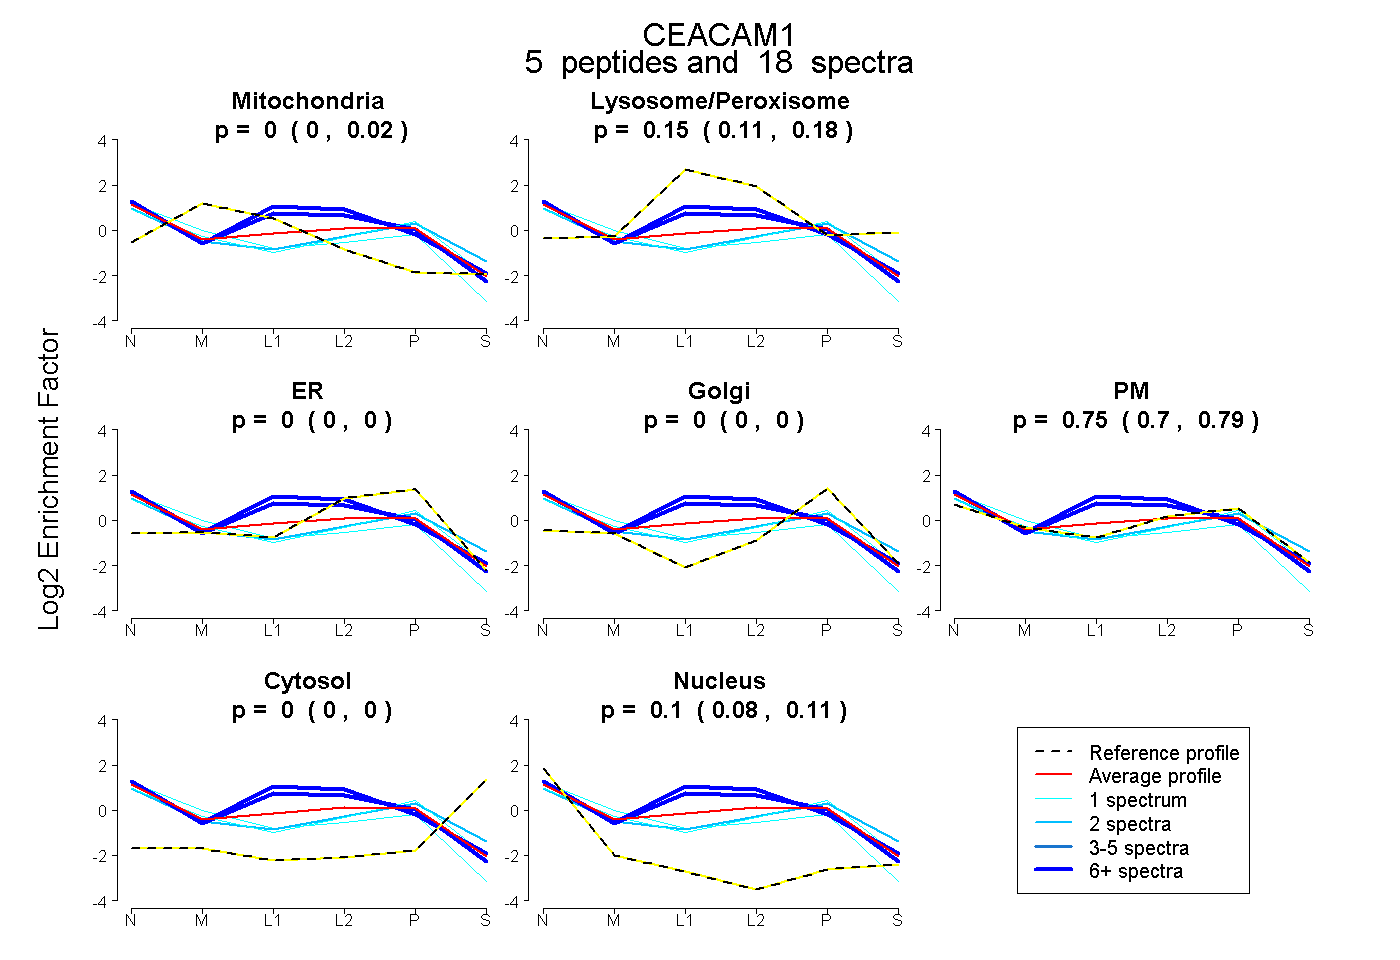
0.000 | 0.019
0.106 | 0.179
0.000 | 0.000
0.000 | 0.000
0.704 | 0.791
0.000 | 0.000
0.082 | 0.112
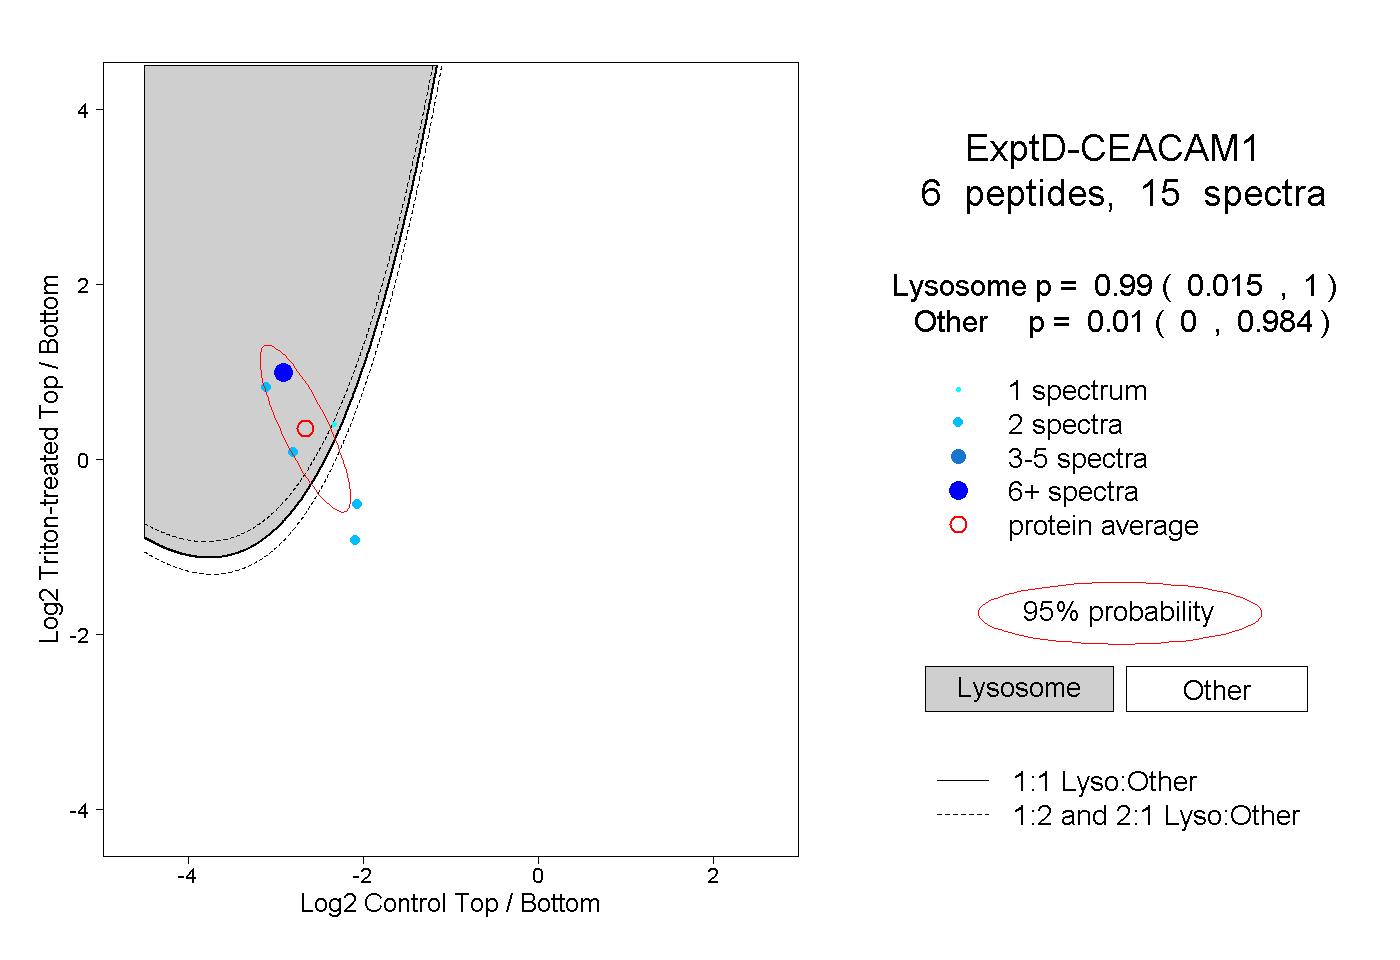
11peptides
spectra
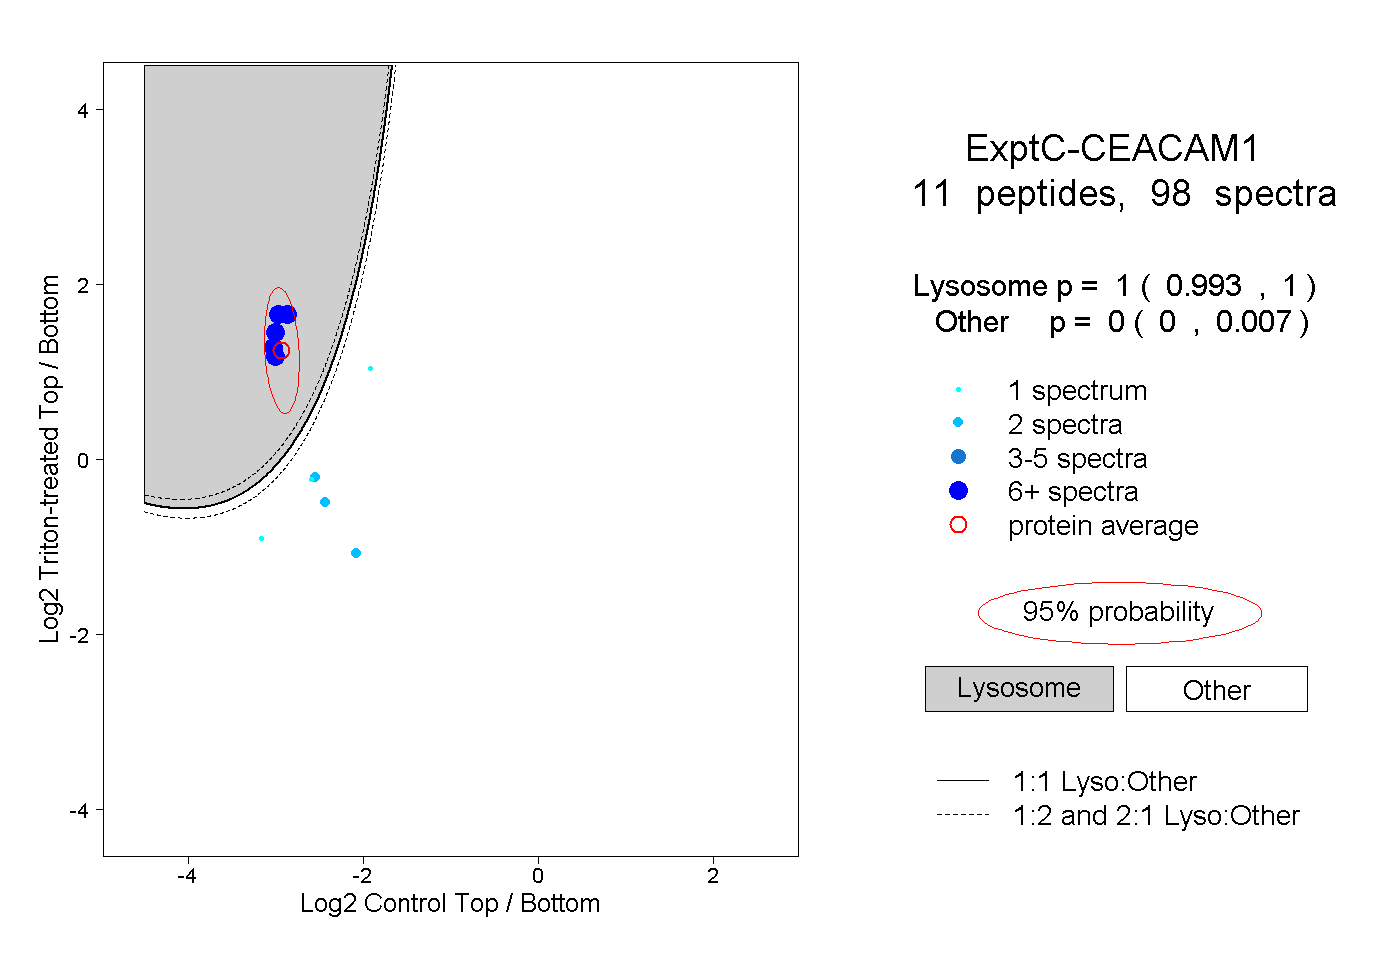
0.993 | 1.000
0.000 | 0.007