CEACAM1
[ENSRNOP00000046654]
Main page
| | | Plot |
Mito |
Lyso |
|
Perox |
ER |
Golgi |
PM |
Cytosol |
Nucleus |
|
| Expt A |
 7
7
peptides |
47
spectra |
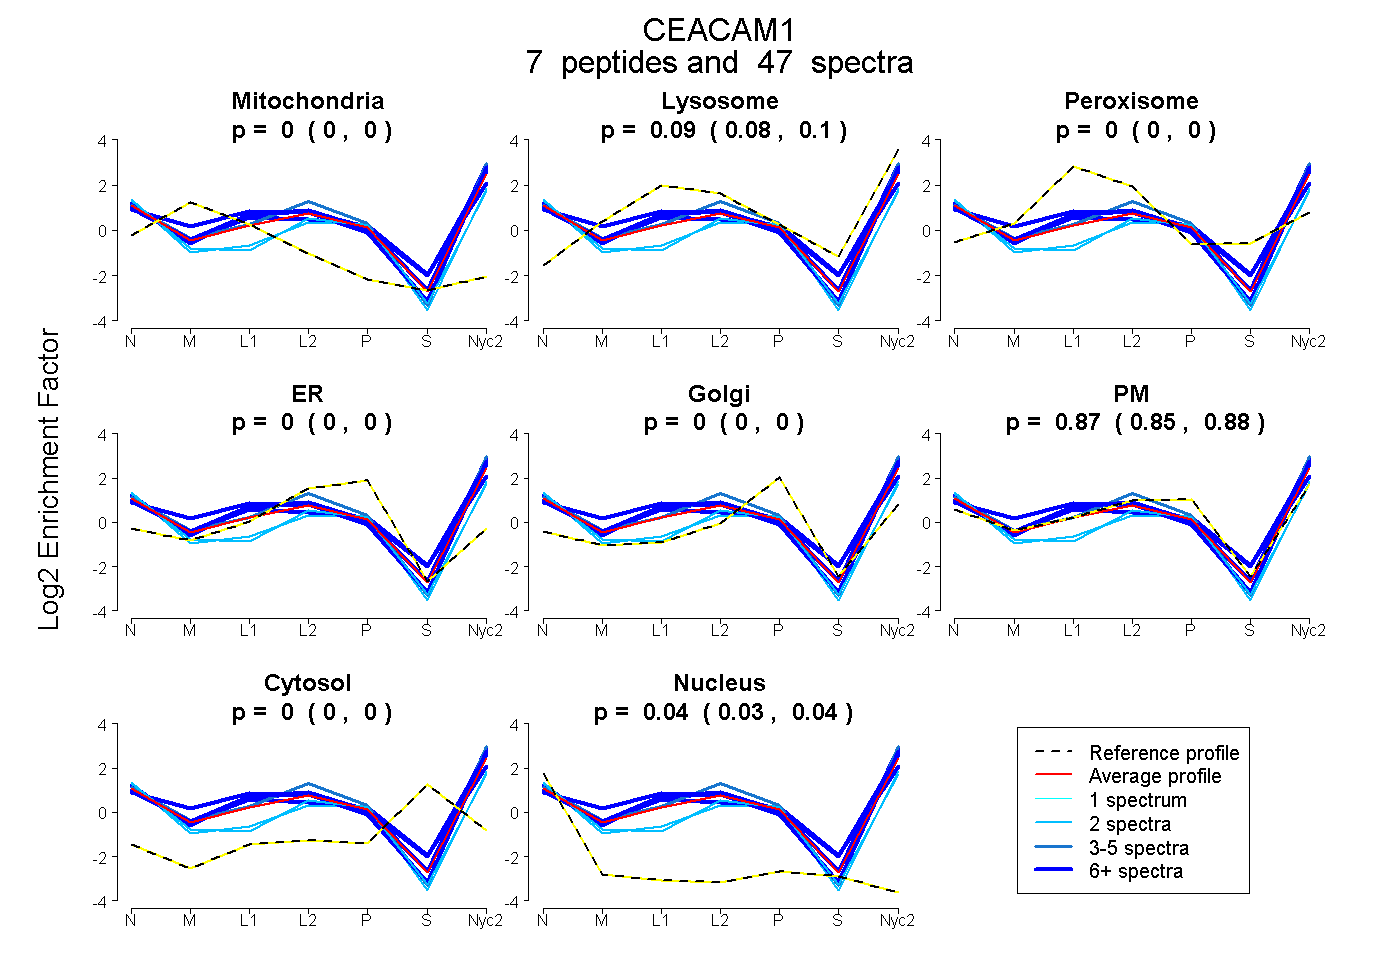 |
0.000
0.000 | 0.000 |
0.093
0.080 | 0.104 |
|
0.000
0.000 | 0.000 |
0.000
0.000 | 0.000 |
0.000
0.000 | 0.000 |
0.867
0.853 | 0.880 |
0.000
0.000 | 0.000 |
0.040
0.035 | 0.043 |
|
| | | Plot |
Mito |
|
Lyso or Perox |
|
ER |
Golgi |
PM |
Cytosol |
Nucleus |
|
| Expt B |
5
peptides |
18
spectra |
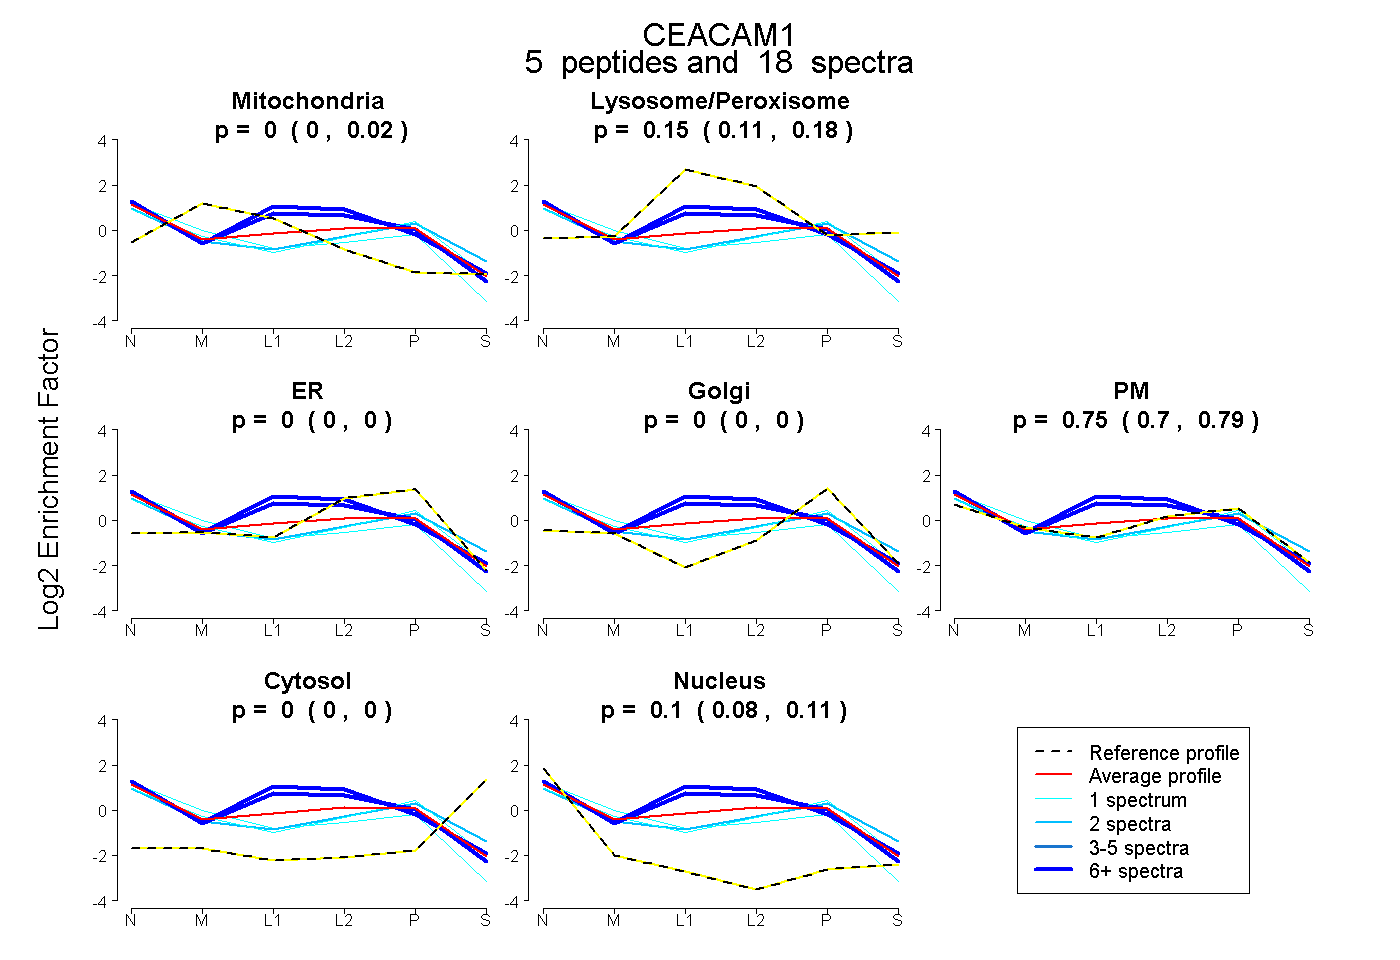 |
0.000
0.000 | 0.019 |
|
0.148
0.106 | 0.179 |
|
0.000
0.000 | 0.000 |
0.000
0.000 | 0.000 |
0.752
0.704 | 0.791 |
0.000
0.000 | 0.000 |
0.100
0.082 | 0.112 |
|
| 8 spectra, TLTLLNVR |
0.000 |
|
0.437 |
|
0.000 |
0.000 |
0.476 |
0.000 |
0.087 |
|
| 6 spectra, GTTLNPDSEIAR |
0.000 |
|
0.305 |
|
0.000 |
0.000 |
0.630 |
0.000 |
0.065 |
|
| 1 spectrum, ISHPIK |
0.000 |
|
0.000 |
|
0.000 |
0.028 |
0.886 |
0.000 |
0.086 |
|
| 1 spectrum, DTGVSVR |
0.125 |
|
0.000 |
|
0.000 |
0.000 |
0.721 |
0.000 |
0.154 |
|
| 2 spectra, ELGSVTLTCFSK |
0.000 |
|
0.036 |
|
0.000 |
0.000 |
0.832 |
0.053 |
0.079 |
|
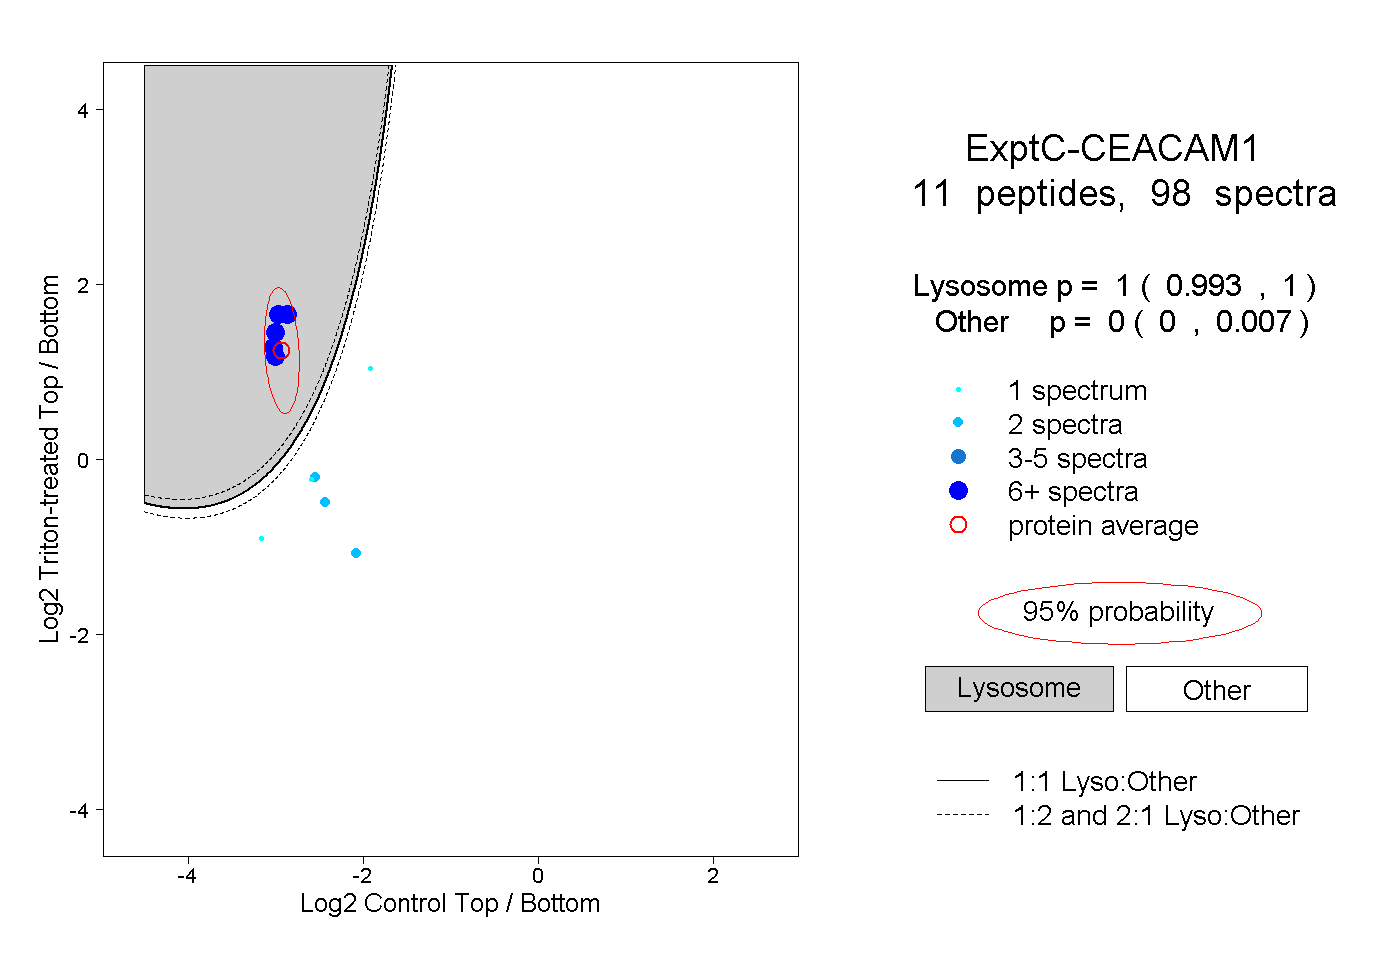
| | | Plot |
|
Lyso |
|
|
|
|
|
|
|
Other |
| Expt C |
11
peptides |
98
spectra |
 |
|
1.000
0.993 | 1.000 |
|
|
|
|
|
|
|
0.000
0.000 | 0.007 |
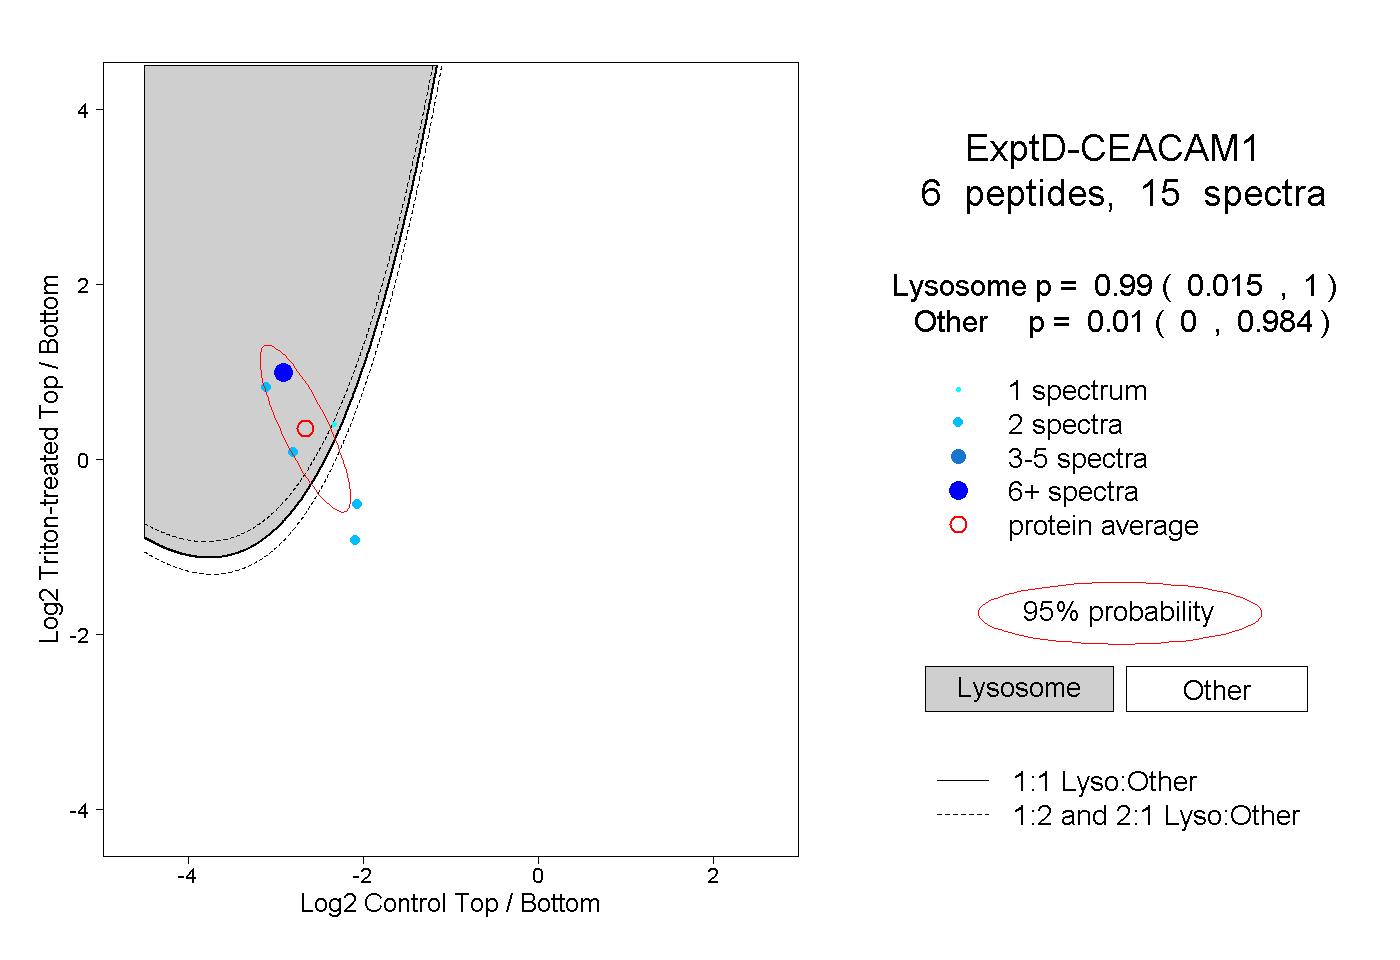
| | | Plot |
|
Lyso |
|
|
|
|
|
|
|
Other |
| Expt D |
6
peptides |
15
spectra |
 |
|
0.990
0.015 | 1.000 |
|
|
|
|
|
|
|
0.010
0.000 | 0.984 |