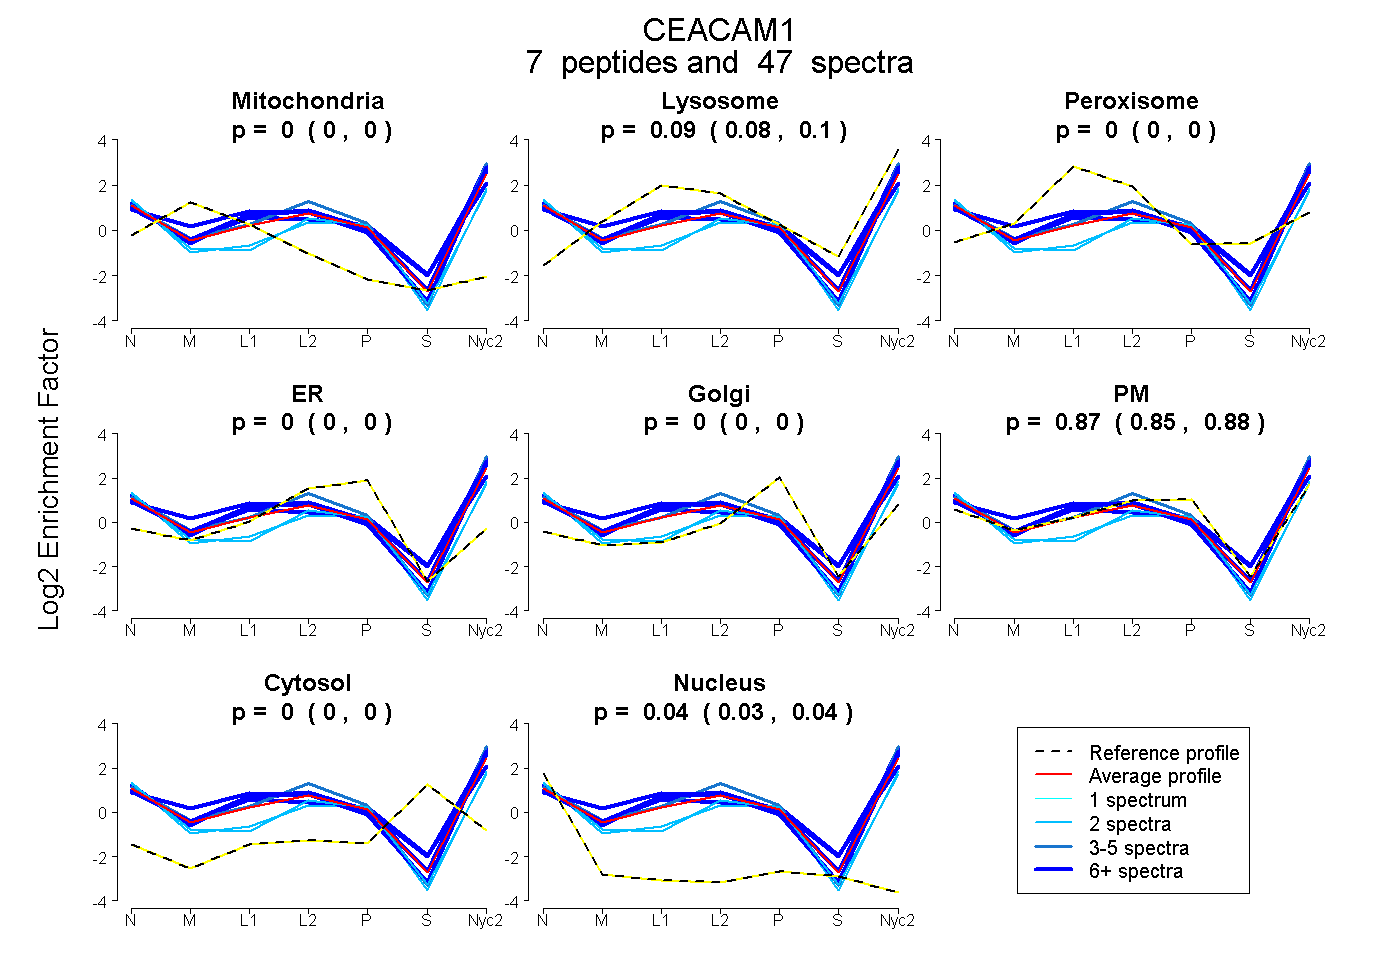
 7
7peptides
spectra
0.000 | 0.000
0.080 | 0.104
0.000 | 0.000
0.000 | 0.000
0.000 | 0.000
0.853 | 0.880
0.000 | 0.000
0.035 | 0.043
| Plot | Mito | Lyso | Perox | ER | Golgi | PM | Cytosol | Nucleus | |||||
| Expt A |
7 peptides |
47 spectra |
|
0.000 0.000 | 0.000 |
0.093 0.080 | 0.104 |
0.000 0.000 | 0.000 |
0.000 0.000 | 0.000 |
0.000 0.000 | 0.000 |
0.867 0.853 | 0.880 |
0.000 0.000 | 0.000 |
0.040 0.035 | 0.043 |
| 10 spectra, TGPAYSGR | 0.000 | 0.275 | 0.000 | 0.000 | 0.000 | 0.681 | 0.000 | 0.044 | ||
| 2 spectra, ISHPIK | 0.000 | 0.000 | 0.000 | 0.000 | 0.000 | 0.866 | 0.000 | 0.134 | ||
| 12 spectra, GYYECEAR | 0.000 | 0.208 | 0.018 | 0.000 | 0.000 | 0.686 | 0.000 | 0.088 | ||
| 7 spectra, TLTLLNVR | 0.046 | 0.196 | 0.000 | 0.000 | 0.000 | 0.758 | 0.000 | 0.000 | ||
| 10 spectra, GTTLNPDSEIAR | 0.000 | 0.145 | 0.000 | 0.000 | 0.000 | 0.849 | 0.000 | 0.005 | ||
| 4 spectra, NGESLSEGDR | 0.000 | 0.063 | 0.000 | 0.000 | 0.000 | 0.937 | 0.000 | 0.000 | ||
| 2 spectra, WLFNSQSLQLTDR | 0.000 | 0.000 | 0.000 | 0.000 | 0.000 | 0.863 | 0.000 | 0.137 |
| Plot | Mito | Lyso or Perox | ER | Golgi | PM | Cytosol | Nucleus | ||||||
| Expt B |
5 peptides |
18 spectra |
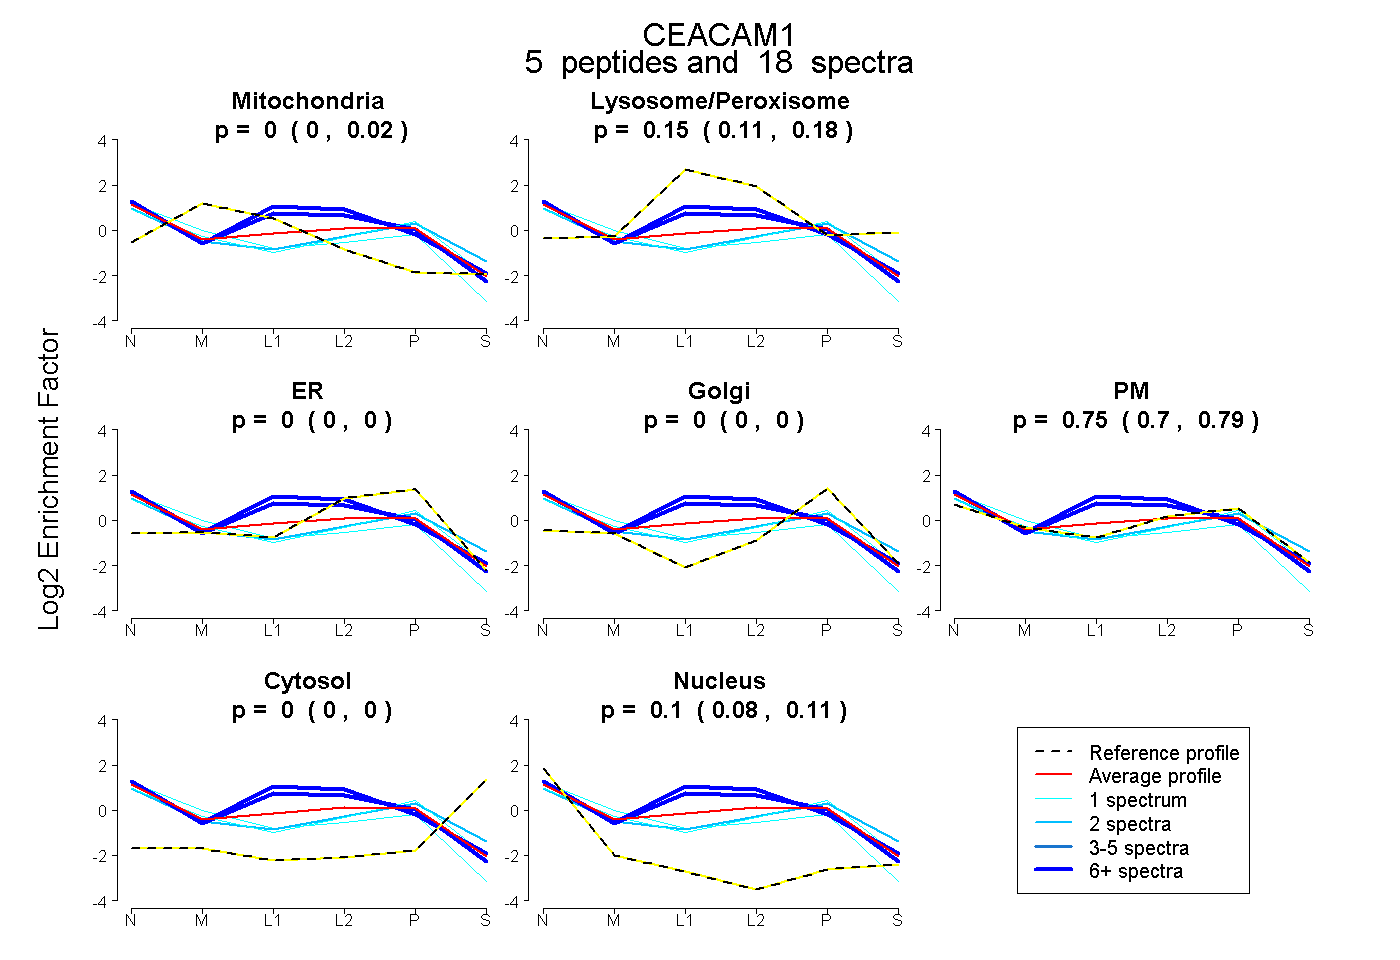 |
0.000 0.000 | 0.019 |
0.148 0.106 | 0.179 |
0.000 0.000 | 0.000 |
0.000 0.000 | 0.000 |
0.752 0.704 | 0.791 |
0.000 0.000 | 0.000 |
0.100 0.082 | 0.112 |
|||
| Plot | Lyso | Other | |||||||||||
| Expt C |
11 peptides |
98 spectra |
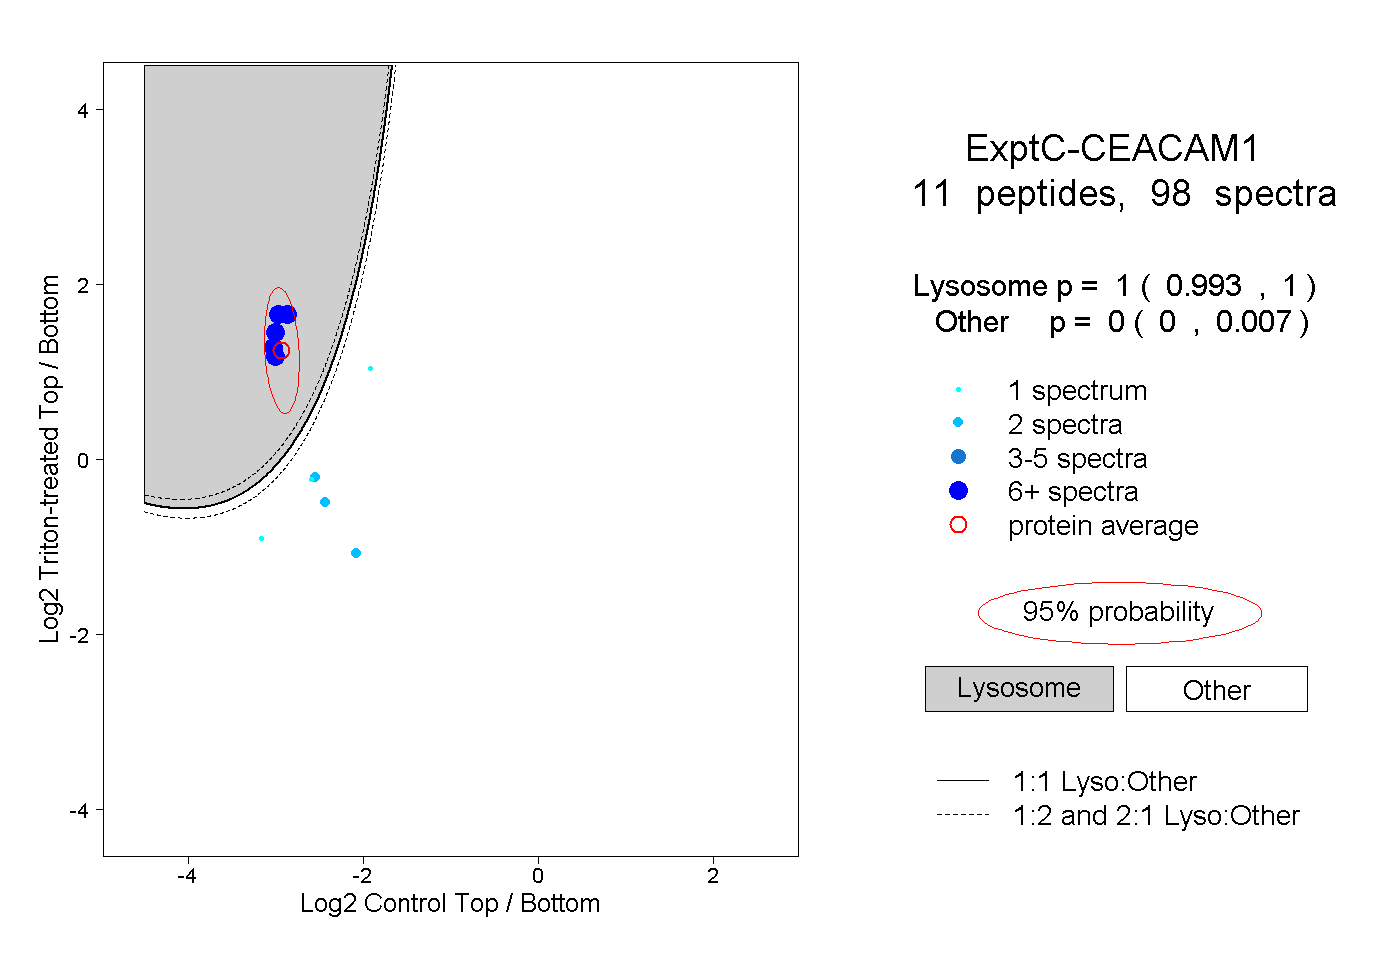 |
1.000 0.993 | 1.000 |
0.000 0.000 | 0.007 |
||||||||
| Plot | Lyso | Other | |||||||||||
| Expt D |
6 peptides |
15 spectra |
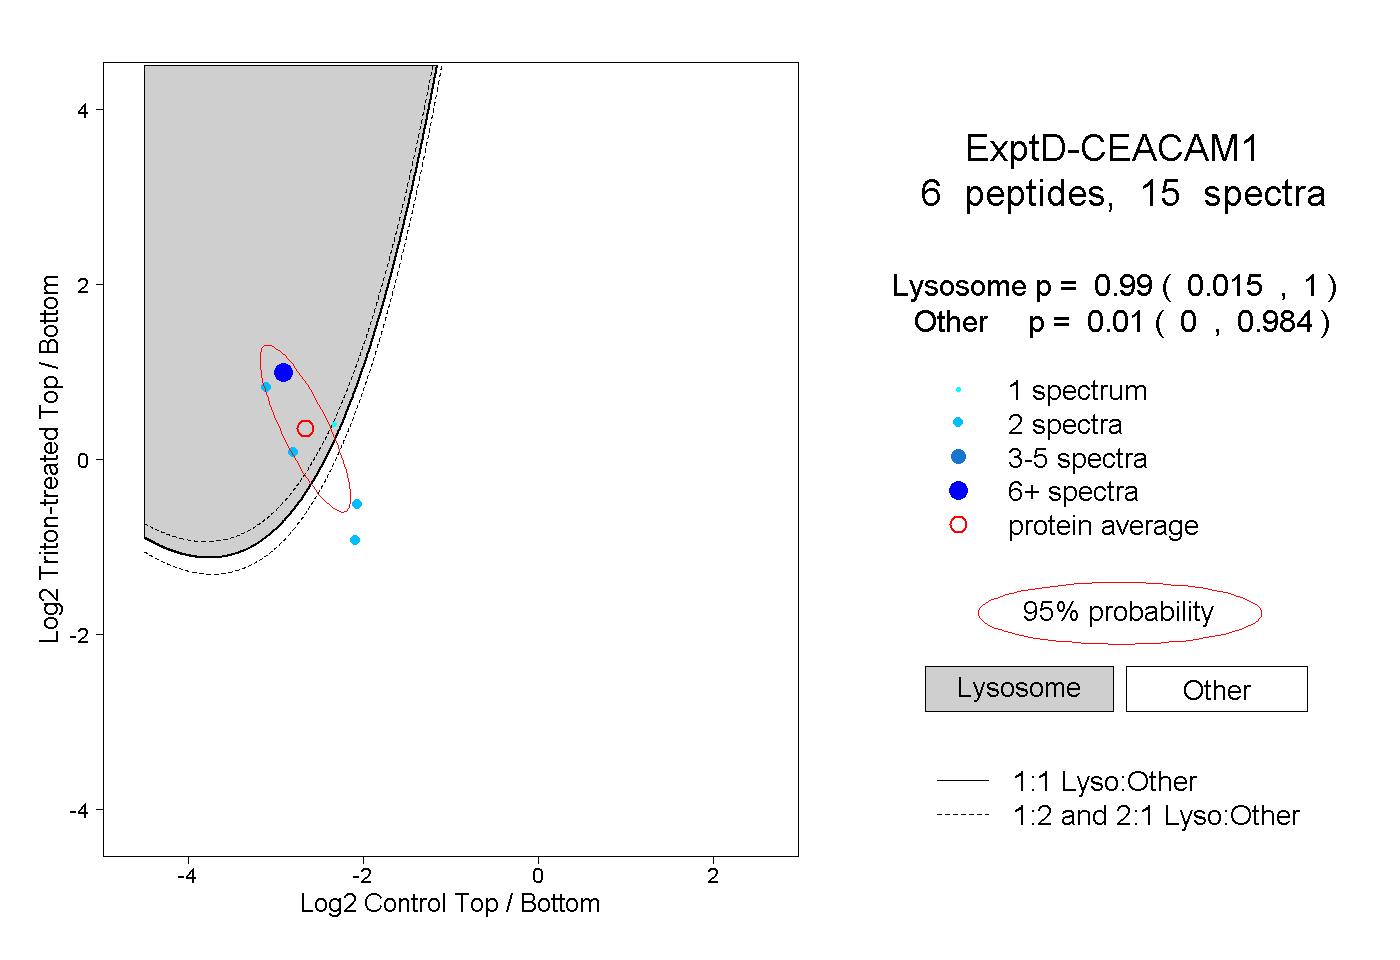 |
0.990 0.015 | 1.000 |
0.010 0.000 | 0.984 |