 3
3peptides
spectra
0.000 | 0.017
0.000 | 0.046
0.000 | 0.000
0.000 | 0.013
0.000 | 0.220
0.000 | 0.000
0.759 | 0.920
0.000 | 0.000
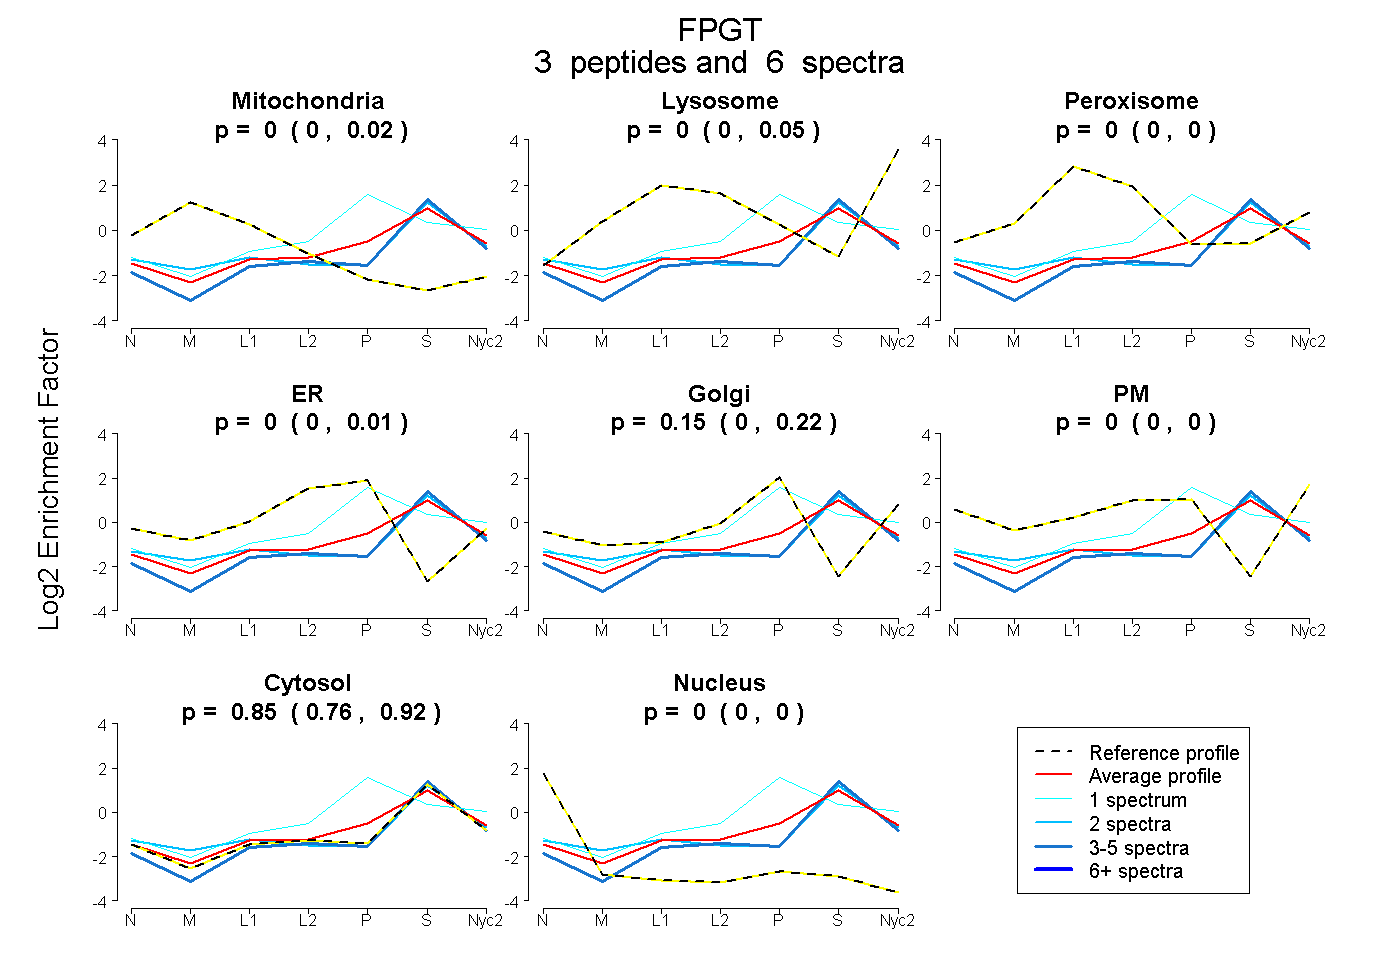
| Plot | Mito | Lyso | Perox | ER | Golgi | PM | Cytosol | Nucleus | |||||
| Expt A |
3 peptides |
6 spectra |
|
0.000 0.000 | 0.017 |
0.000 0.000 | 0.046 |
0.000 0.000 | 0.000 |
0.000 0.000 | 0.013 |
0.146 0.000 | 0.220 |
0.000 0.000 | 0.000 |
0.854 0.759 | 0.920 |
0.000 0.000 | 0.000 |
| 1 spectrum, VLLIHSGGYSQR | 0.000 | 0.000 | 0.000 | 0.000 | 0.521 | 0.000 | 0.479 | 0.000 | ||
| 2 spectra, EDSQLLDMR | 0.089 | 0.018 | 0.000 | 0.000 | 0.000 | 0.000 | 0.892 | 0.000 | ||
| 3 spectra, IFHLLK | 0.000 | 0.000 | 0.000 | 0.000 | 0.000 | 0.000 | 1.000 | 0.000 |
| Plot | Mito | Lyso or Perox | ER | Golgi | PM | Cytosol | Nucleus | ||||||
| Expt B |
1 peptide |
1 spectrum |
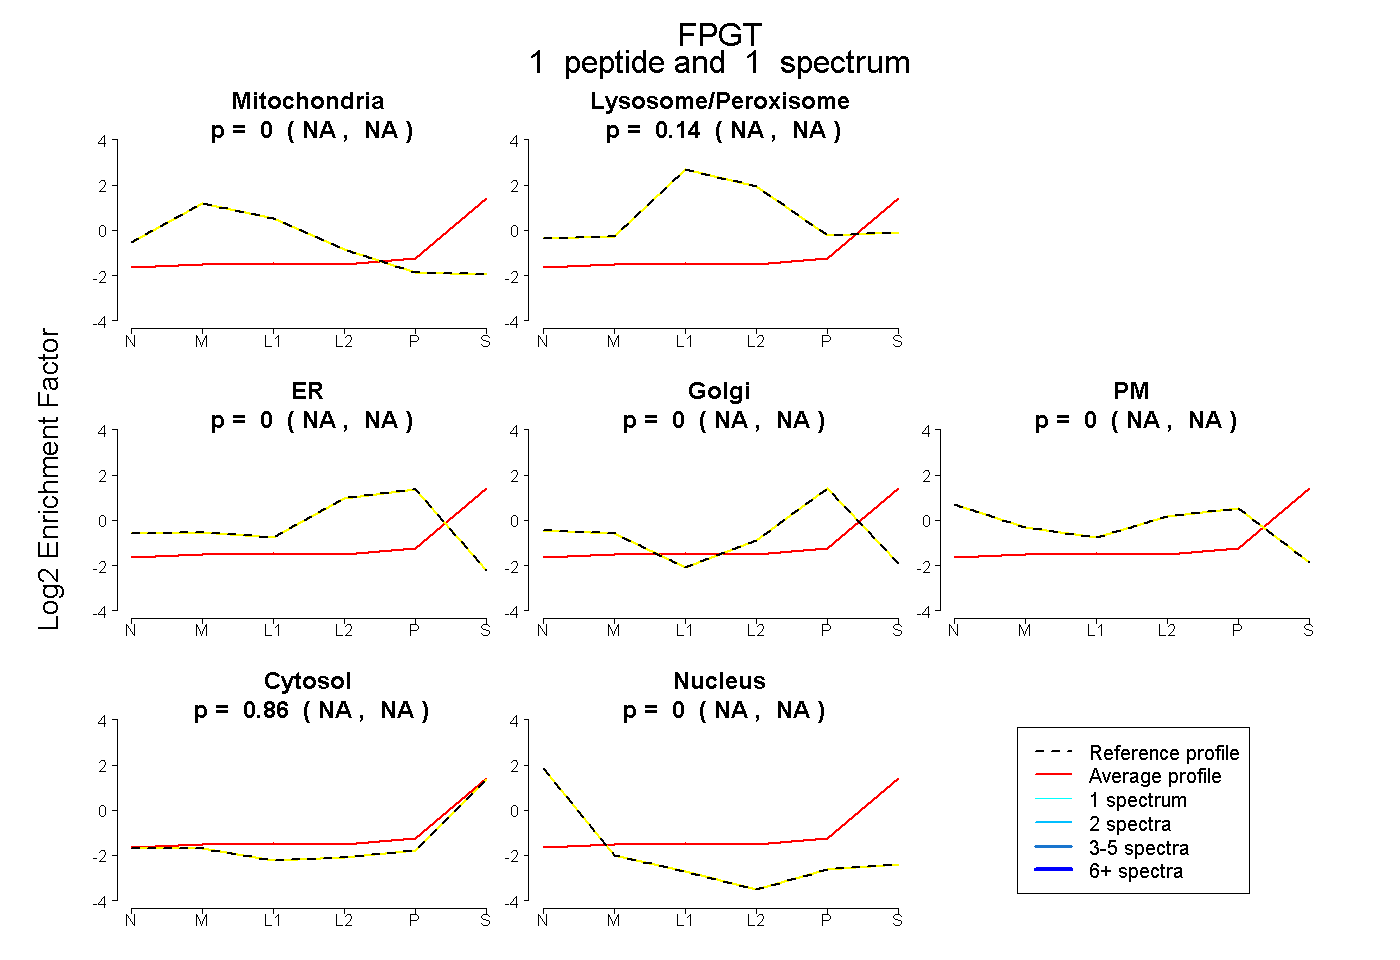 |
0.000 NA | NA |
0.145 NA | NA |
0.000 NA | NA |
0.000 NA | NA |
0.000 NA | NA |
0.855 NA | NA |
0.000 NA | NA |