 8
8peptides
spectra
0.000 | 0.000
0.377 | 0.395
0.000 | 0.000
0.000 | 0.000
0.000 | 0.000
0.000 | 0.000
0.604 | 0.621
0.000 | 0.000
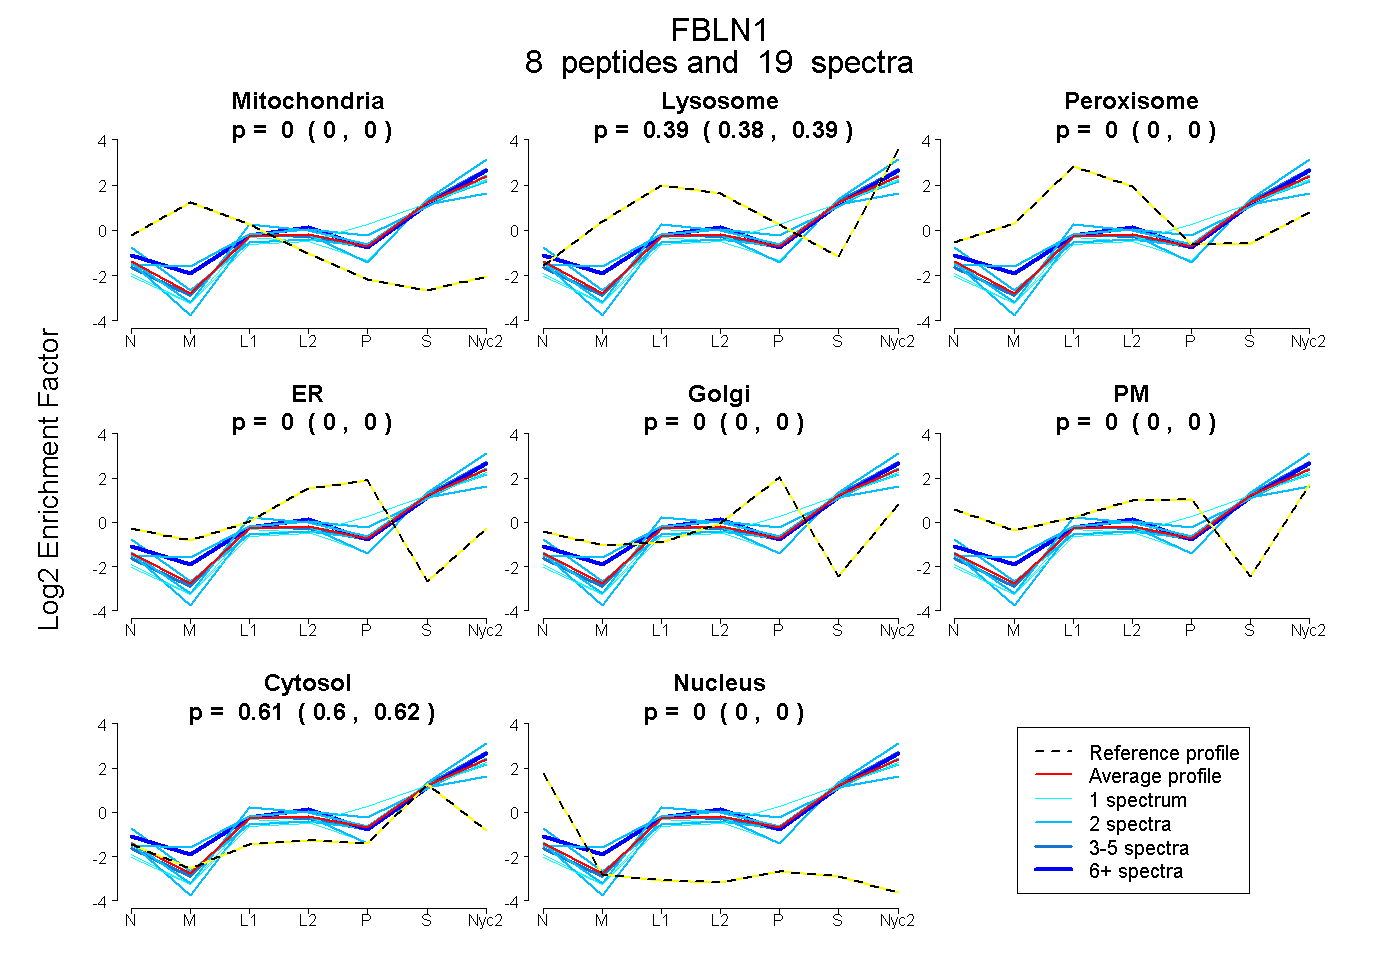
| Plot | Mito | Lyso | Perox | ER | Golgi | PM | Cytosol | Nucleus | |||||
| Expt A |
8 peptides |
19 spectra |
|
0.000 0.000 | 0.000 |
0.386 0.377 | 0.395 |
0.000 0.000 | 0.000 |
0.000 0.000 | 0.000 |
0.000 0.000 | 0.000 |
0.000 0.000 | 0.000 |
0.614 0.604 | 0.621 |
0.000 0.000 | 0.000 |
| 1 spectrum, DCSLSYTSESK | 0.000 | 0.308 | 0.000 | 0.000 | 0.000 | 0.000 | 0.692 | 0.000 | ||
| 2 spectra, EFTRPEEIIFLR | 0.000 | 0.363 | 0.000 | 0.000 | 0.000 | 0.000 | 0.637 | 0.000 | ||
| 1 spectrum, YEDGMTVGVVR | 0.000 | 0.338 | 0.000 | 0.000 | 0.000 | 0.000 | 0.662 | 0.000 | ||
| 3 spectra, DSFDIIK | 0.000 | 0.401 | 0.000 | 0.000 | 0.000 | 0.000 | 0.599 | 0.000 | ||
| 2 spectra, QVRPIVGPFYAVLK | 0.000 | 0.488 | 0.000 | 0.000 | 0.000 | 0.000 | 0.512 | 0.000 | ||
| 2 spectra, GQENSDFVR | 0.000 | 0.304 | 0.000 | 0.000 | 0.000 | 0.000 | 0.696 | 0.000 | ||
| 2 spectra, TCVDINECQR | 0.000 | 0.386 | 0.000 | 0.000 | 0.000 | 0.000 | 0.614 | 0.000 | ||
| 6 spectra, NVPNCGR | 0.000 | 0.472 | 0.000 | 0.000 | 0.000 | 0.000 | 0.528 | 0.000 |
| Plot | Mito | Lyso or Perox | ER | Golgi | PM | Cytosol | Nucleus | ||||||
| Expt B |
2 peptides |
2 spectra |
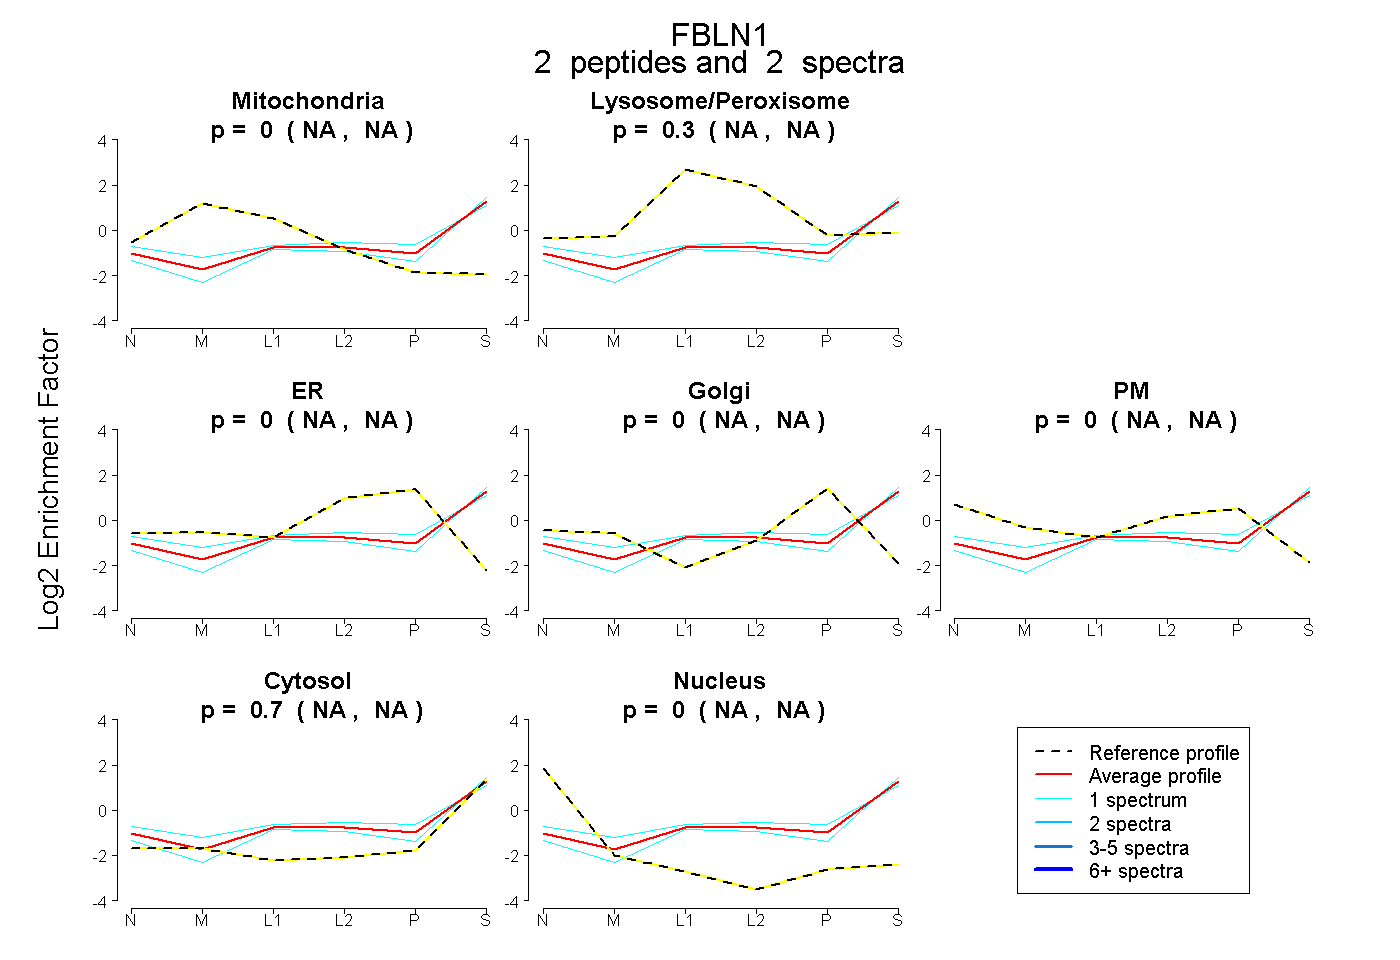 |
0.000 NA | NA |
0.302 NA | NA |
0.000 NA | NA |
0.000 NA | NA |
0.000 NA | NA |
0.698 NA | NA |
0.000 NA | NA |
|||
| Plot | Lyso | Other | |||||||||||
| Expt C |
10 peptides |
35 spectra |
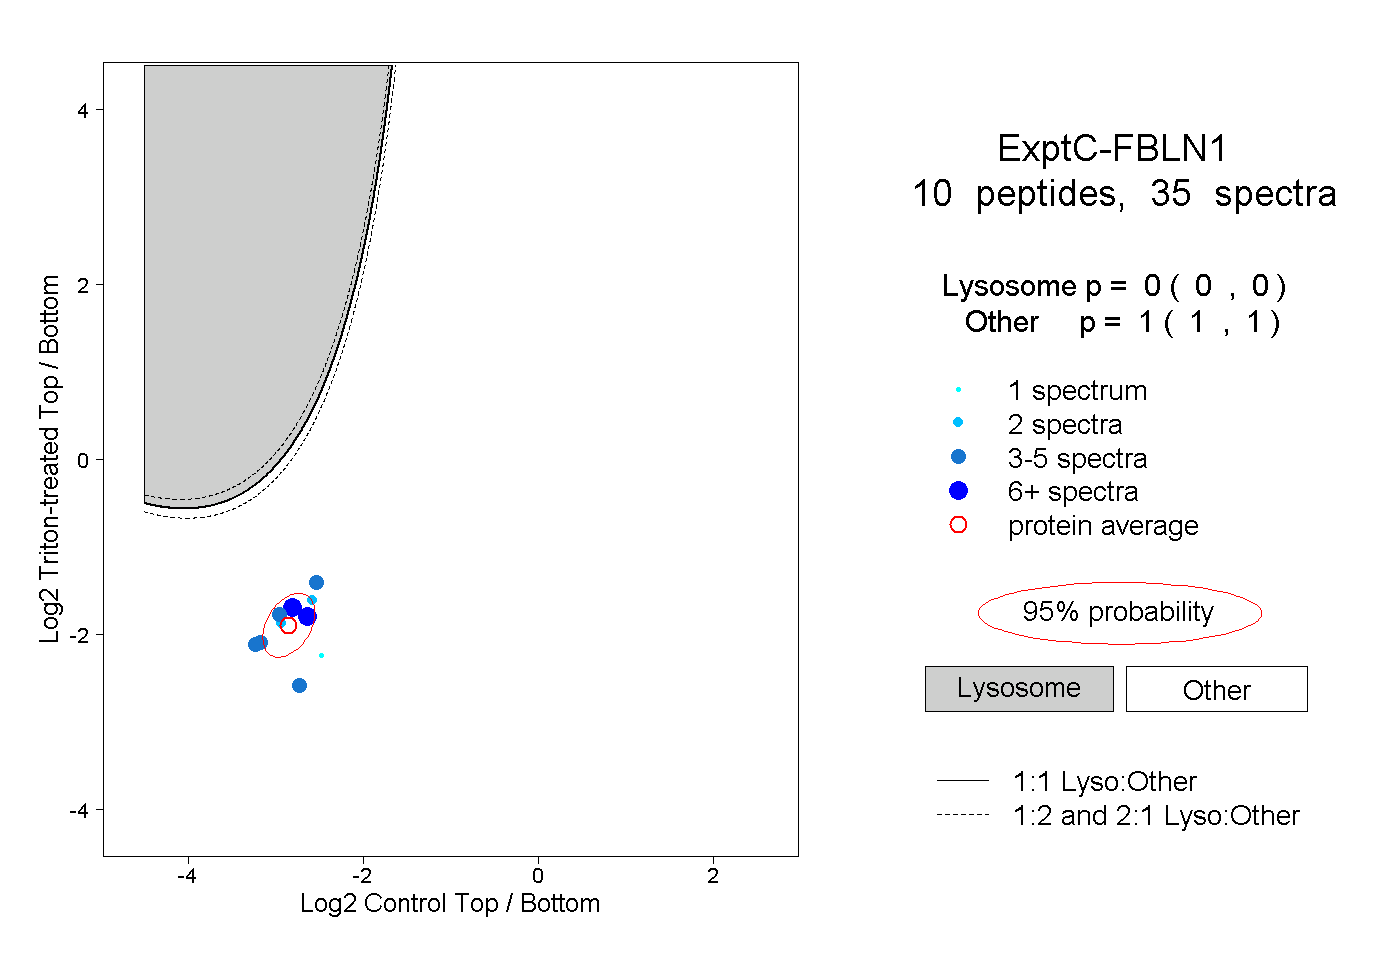 |
0.000 0.000 | 0.000 |
1.000 1.000 | 1.000 |
||||||||
| Plot | Lyso | Other | |||||||||||
| Expt D |
1 peptide |
2 spectra |
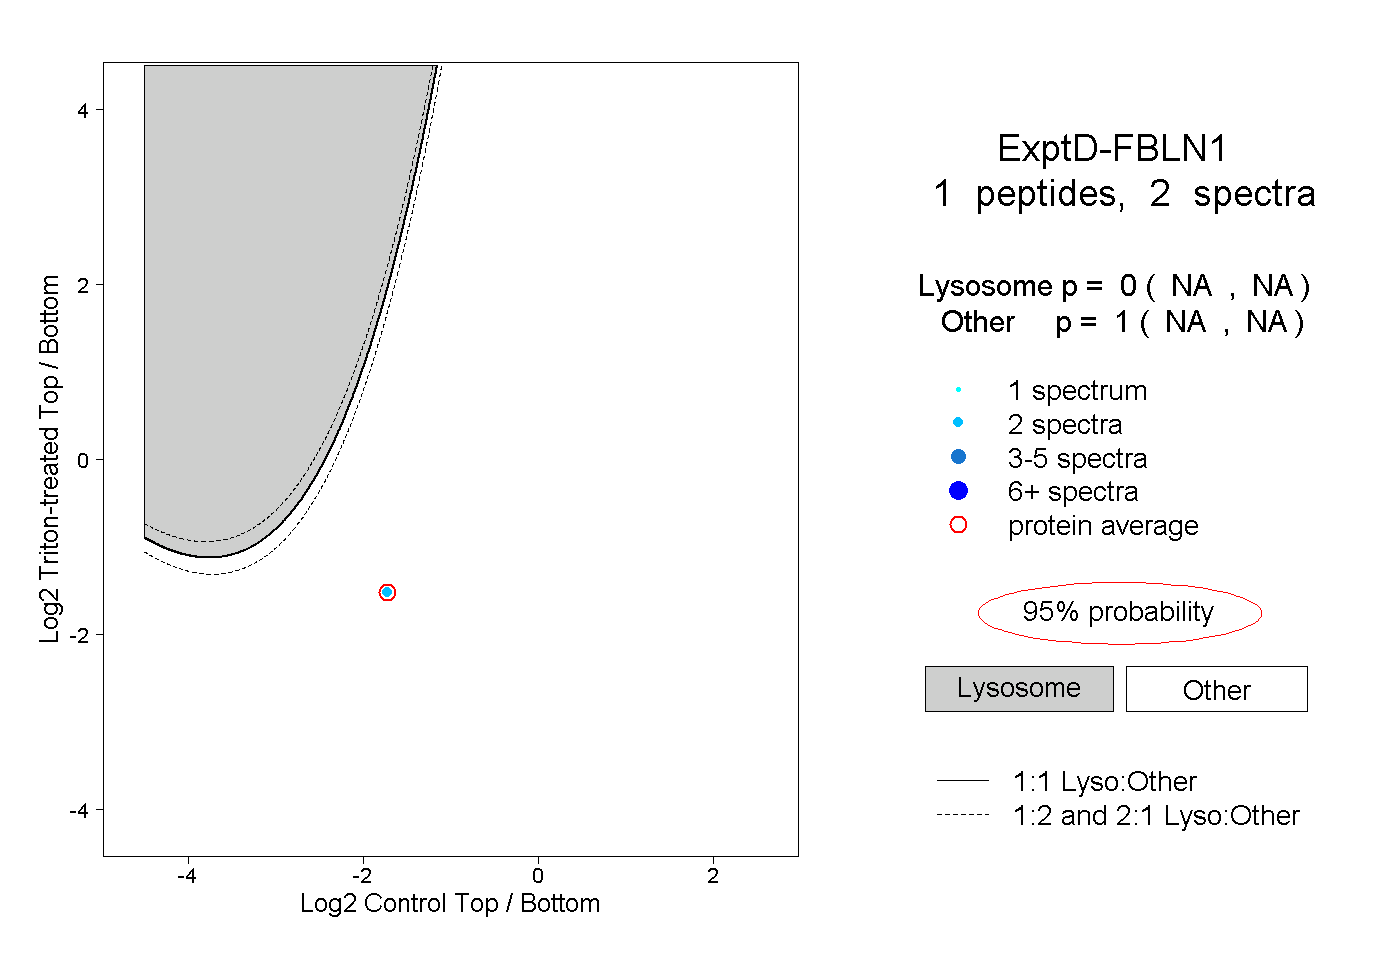 |
0.000 NA | NA |
1.000 NA | NA |