 10
10peptides
spectra
0.656 | 0.694
0.000 | 0.035
0.149 | 0.200
0.000 | 0.000
0.000 | 0.000
0.000 | 0.048
0.092 | 0.116
0.000 | 0.000
| Plot | Mito | Lyso | Perox | ER | Golgi | PM | Cytosol | Nucleus | |||||
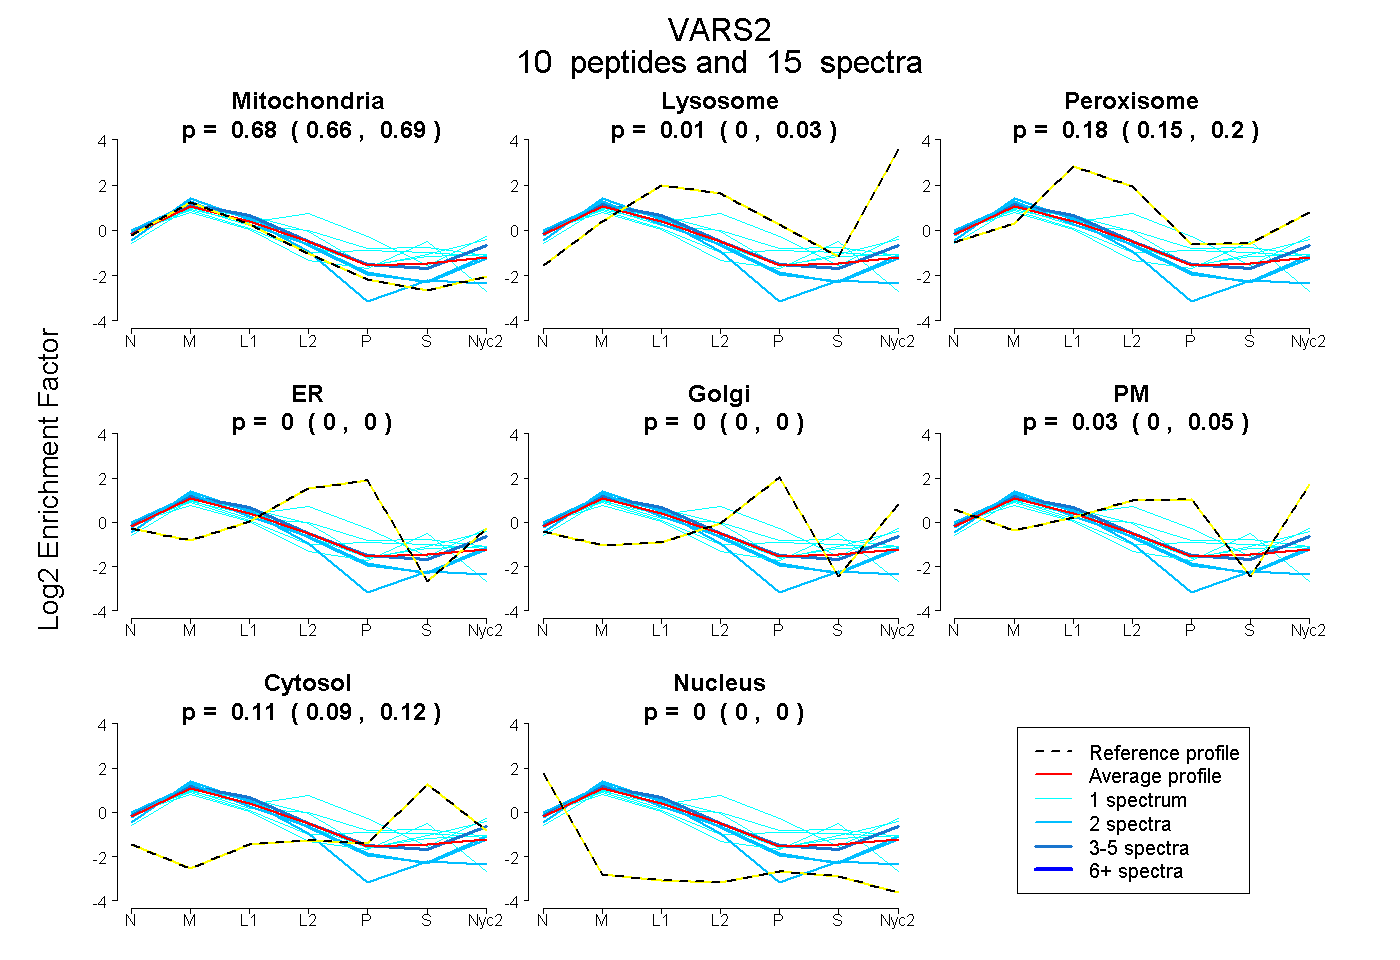
| Expt A |
10 peptides |
15 spectra |
|
0.675 0.656 | 0.694 |
0.006 0.000 | 0.035 |
0.183 0.149 | 0.200 |
0.000 0.000 | 0.000 |
0.000 0.000 | 0.000 |
0.030 0.000 | 0.048 |
0.105 0.092 | 0.116 |
0.000 0.000 | 0.000 |
| 3 spectra, SAISDIEVESRPLPGR | 0.680 | 0.142 | 0.109 | 0.000 | 0.000 | 0.025 | 0.045 | 0.000 | ||
| 1 spectrum, ATYQLTR | 0.636 | 0.017 | 0.218 | 0.000 | 0.000 | 0.000 | 0.130 | 0.000 | ||
| 1 spectrum, DIISGQELQVLQAK | 0.580 | 0.000 | 0.121 | 0.000 | 0.107 | 0.010 | 0.182 | 0.000 | ||
| 2 spectra, EGFFKPEYQAR | 0.818 | 0.085 | 0.067 | 0.000 | 0.000 | 0.022 | 0.000 | 0.009 | ||
| 1 spectrum, GLQEHPMVLPICSR | 0.369 | 0.033 | 0.218 | 0.163 | 0.000 | 0.190 | 0.027 | 0.000 | ||
| 1 spectrum, HPLTGQHLPLITDTTVQPHVGTGAVK | 0.530 | 0.088 | 0.268 | 0.000 | 0.000 | 0.003 | 0.110 | 0.000 | ||
| 1 spectrum, LAFAANECER | 0.722 | 0.000 | 0.000 | 0.000 | 0.000 | 0.000 | 0.278 | 0.000 | ||
| 1 spectrum, QLWWGHQIPAYR | 0.472 | 0.000 | 0.256 | 0.078 | 0.015 | 0.000 | 0.180 | 0.000 | ||
| 2 spectra, QLVNWSCTLR | 1.000 | 0.000 | 0.000 | 0.000 | 0.000 | 0.000 | 0.000 | 0.000 | ||
| 2 spectra, TVSDGPAER | 0.857 | 0.107 | 0.000 | 0.000 | 0.000 | 0.031 | 0.005 | 0.000 |
| Plot | Mito | Lyso or Perox | ER | Golgi | PM | Cytosol | Nucleus | ||||||
| Expt B |
3 peptides |
3 spectra |
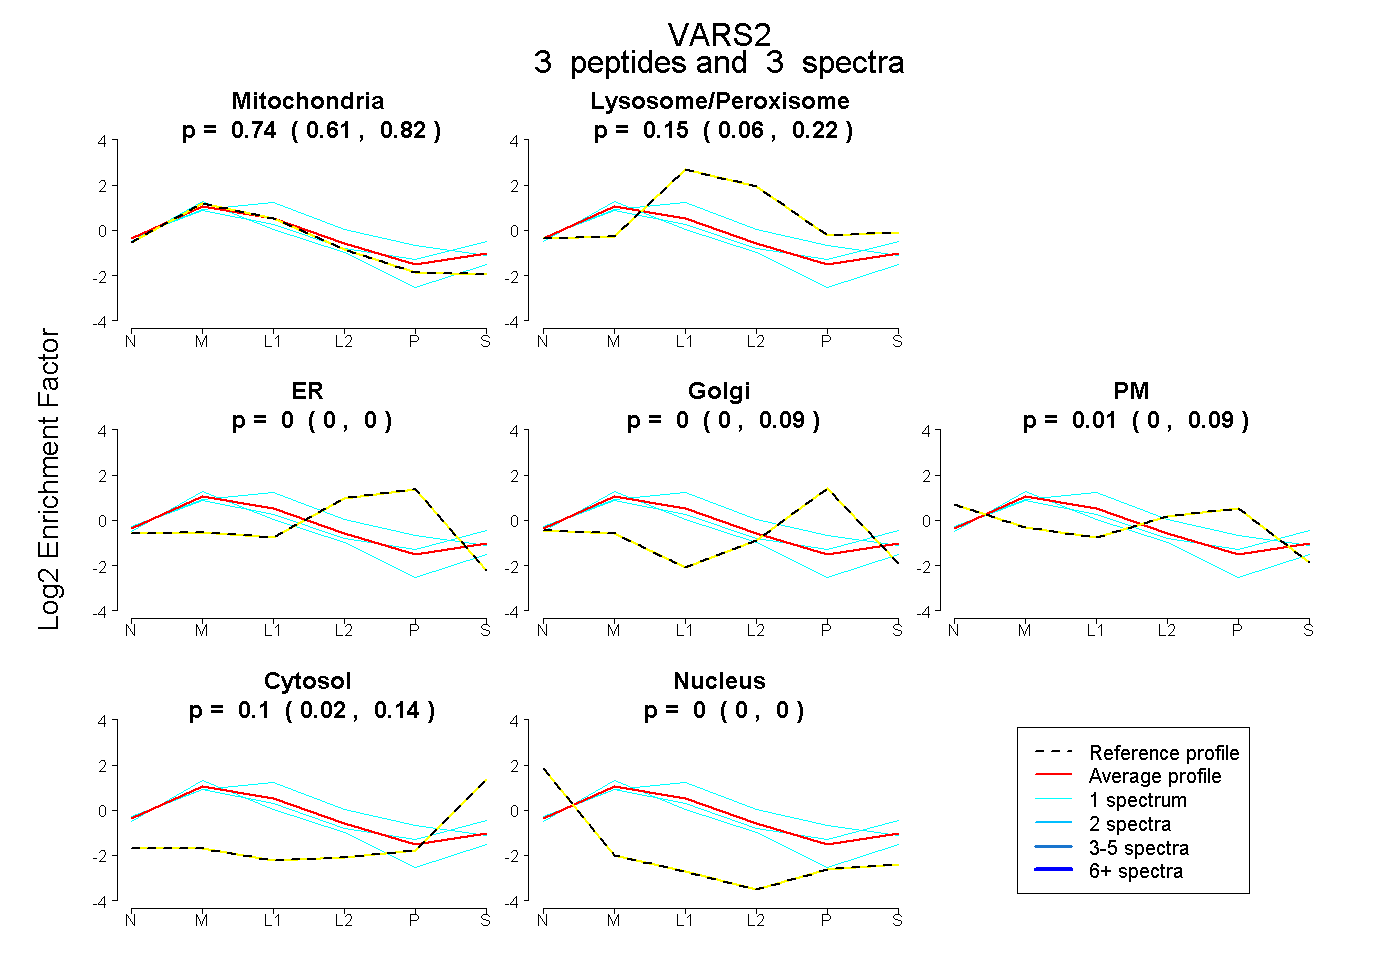 |
0.745 0.610 | 0.822 |
0.148 0.058 | 0.221 |
0.000 0.000 | 0.000 |
0.000 0.000 | 0.094 |
0.012 0.000 | 0.088 |
0.096 0.024 | 0.139 |
0.000 0.000 | 0.000 |
|||
| Plot | Lyso | Other | |||||||||||
| Expt C |
16 peptides |
54 spectra |
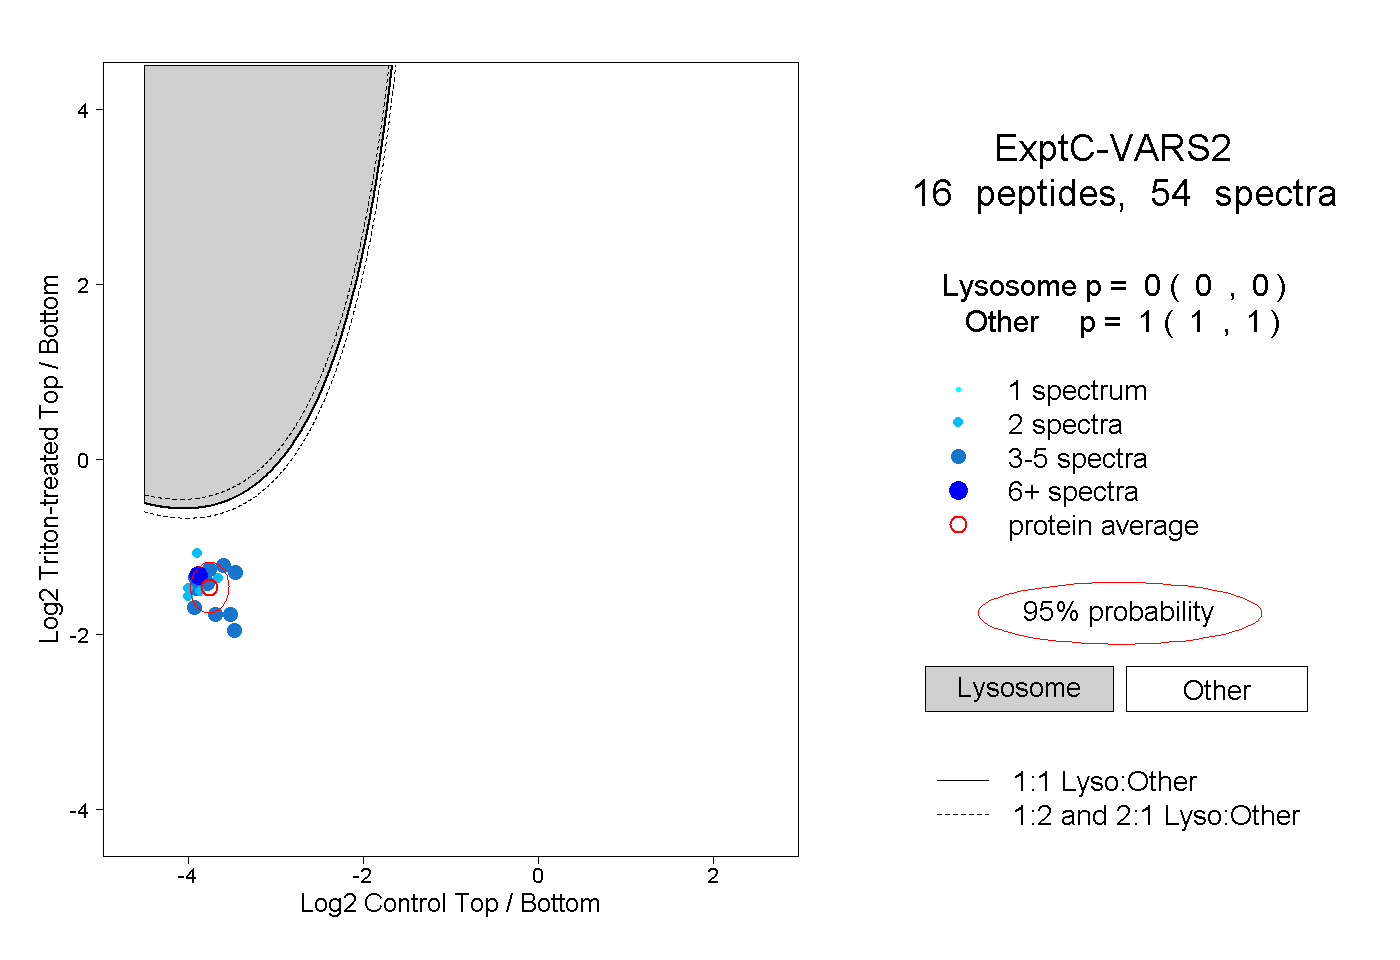 |
0.000 0.000 | 0.000 |
1.000 1.000 | 1.000 |
||||||||
| Plot | Lyso | Other | |||||||||||
| Expt D |
3 peptides |
5 spectra |
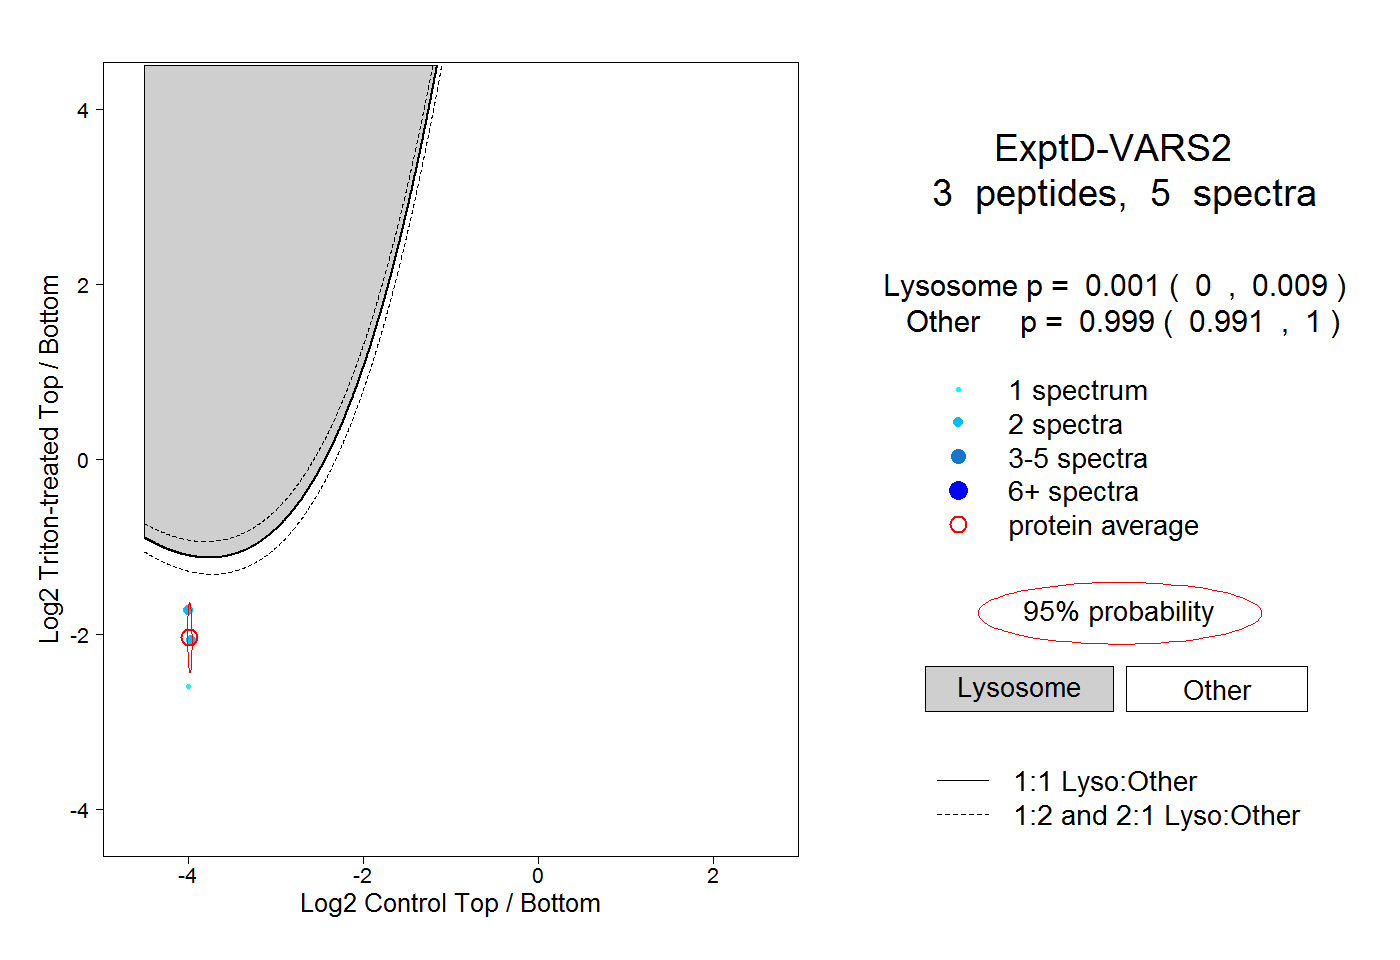 |
0.001 0.000 | 0.009 |
0.999 0.991 | 1.000 |