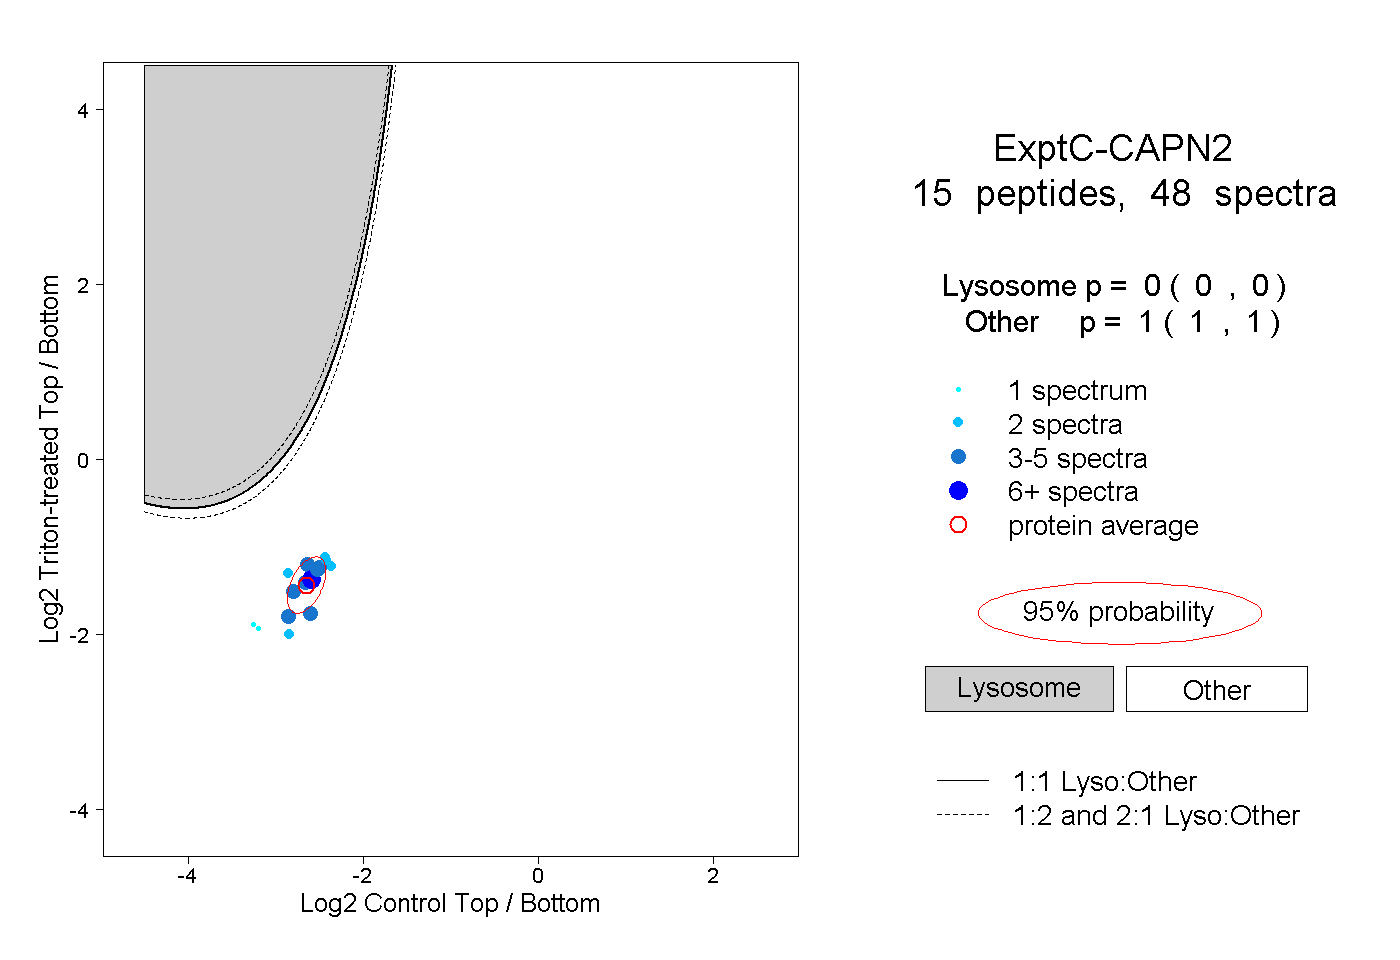
14
14peptides
spectra
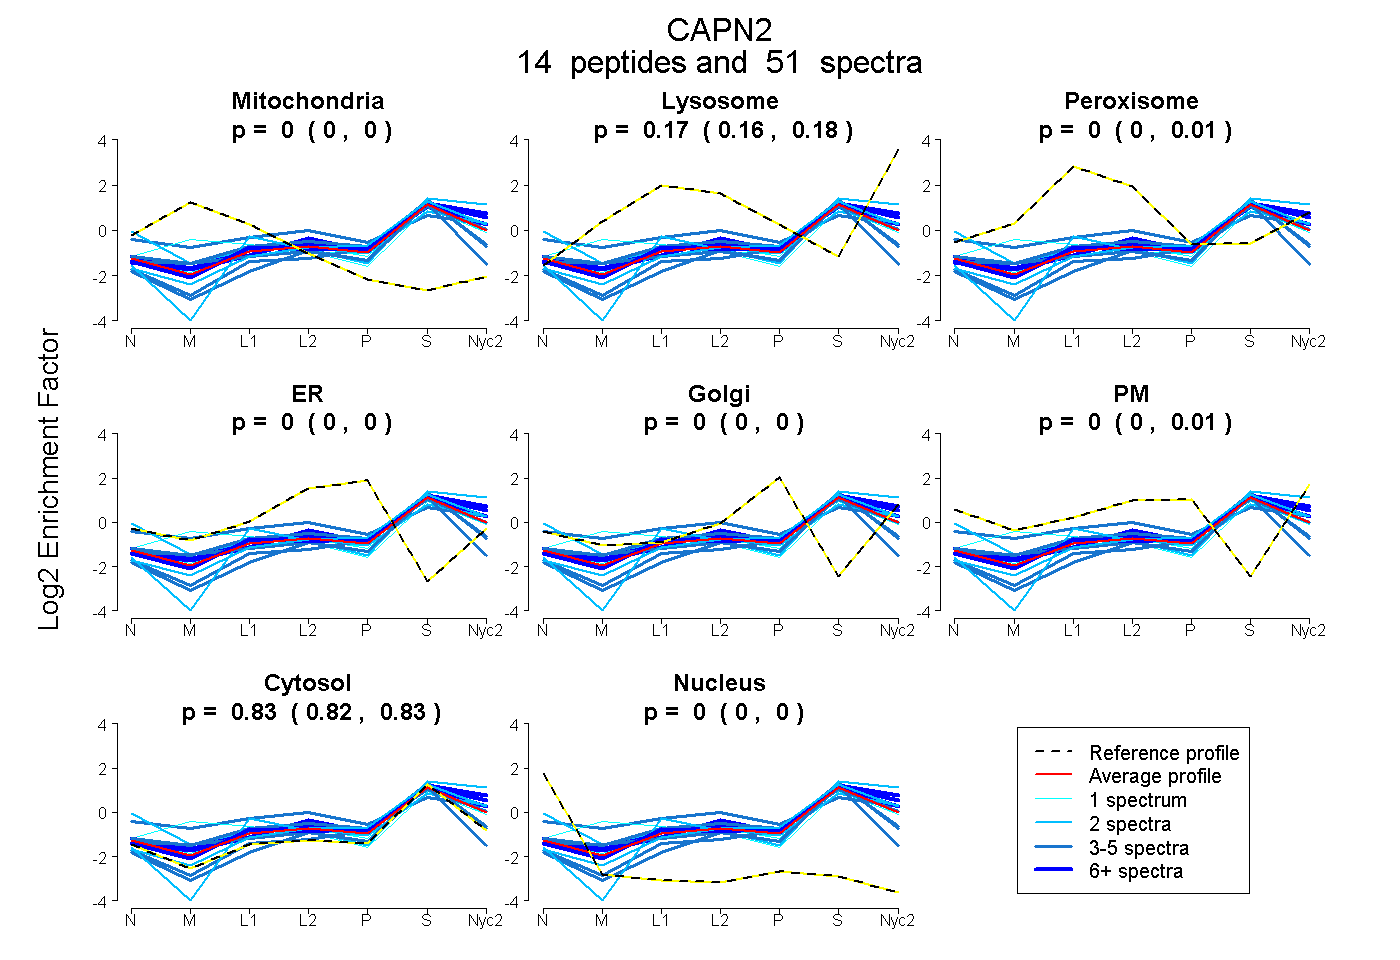
0.000 | 0.000
0.158 | 0.176
0.000 | 0.006
0.000 | 0.000
0.000 | 0.000
0.000 | 0.008
0.822 | 0.832
0.000 | 0.000
6peptides
spectra
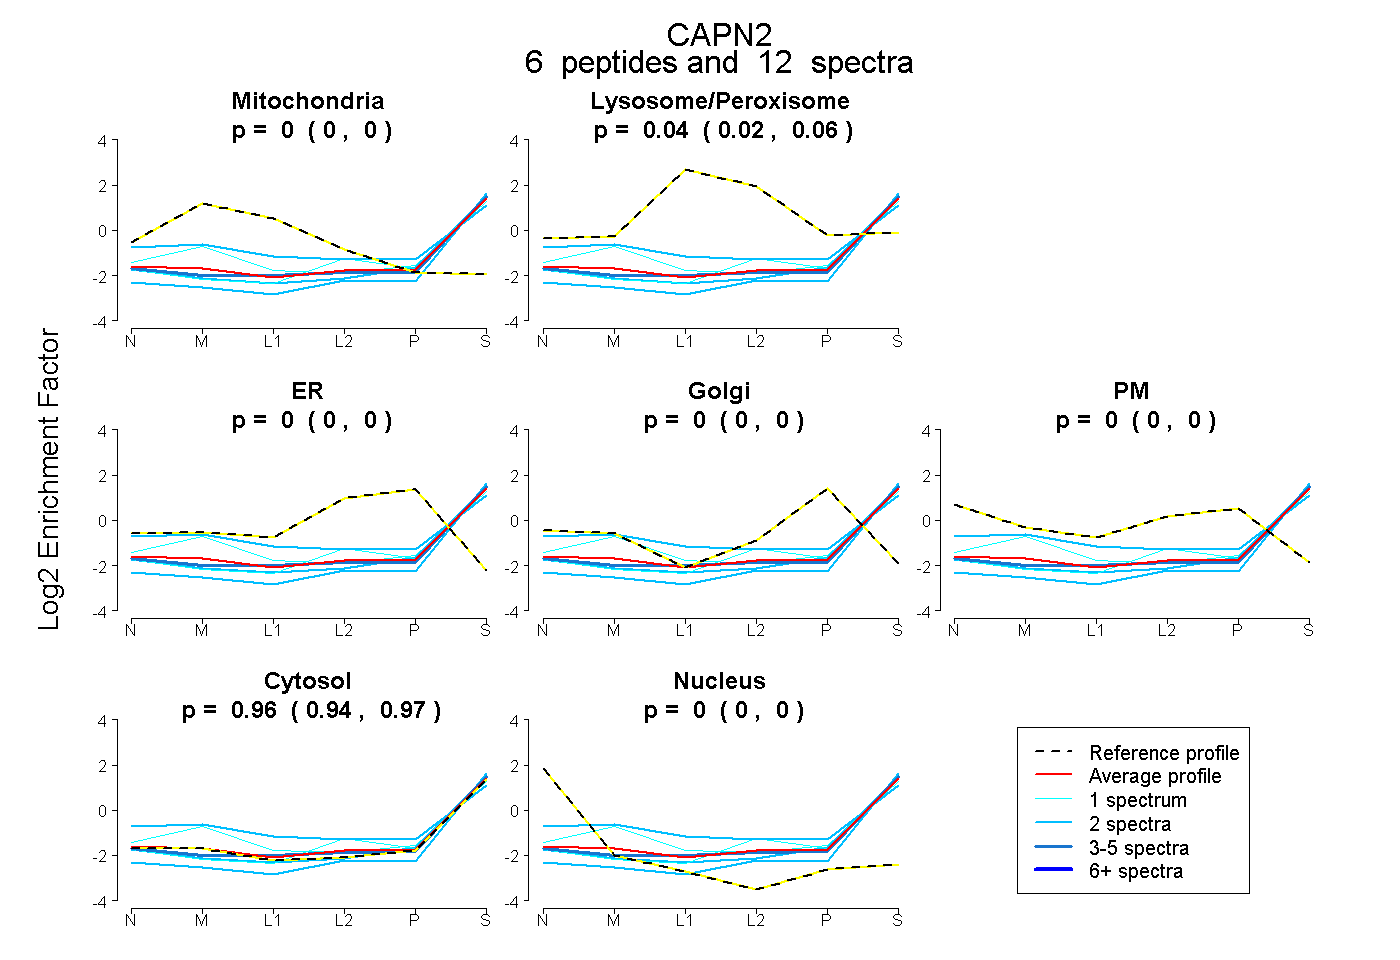
0.000 | 0.000
0.023 | 0.057
0.000 | 0.005
0.000 | 0.000
0.000 | 0.004
0.940 | 0.969
0.000 | 0.000