 14
14peptides
spectra
0.000 | 0.000
0.158 | 0.176
0.000 | 0.006
0.000 | 0.000
0.000 | 0.000
0.000 | 0.008
0.822 | 0.832
0.000 | 0.000
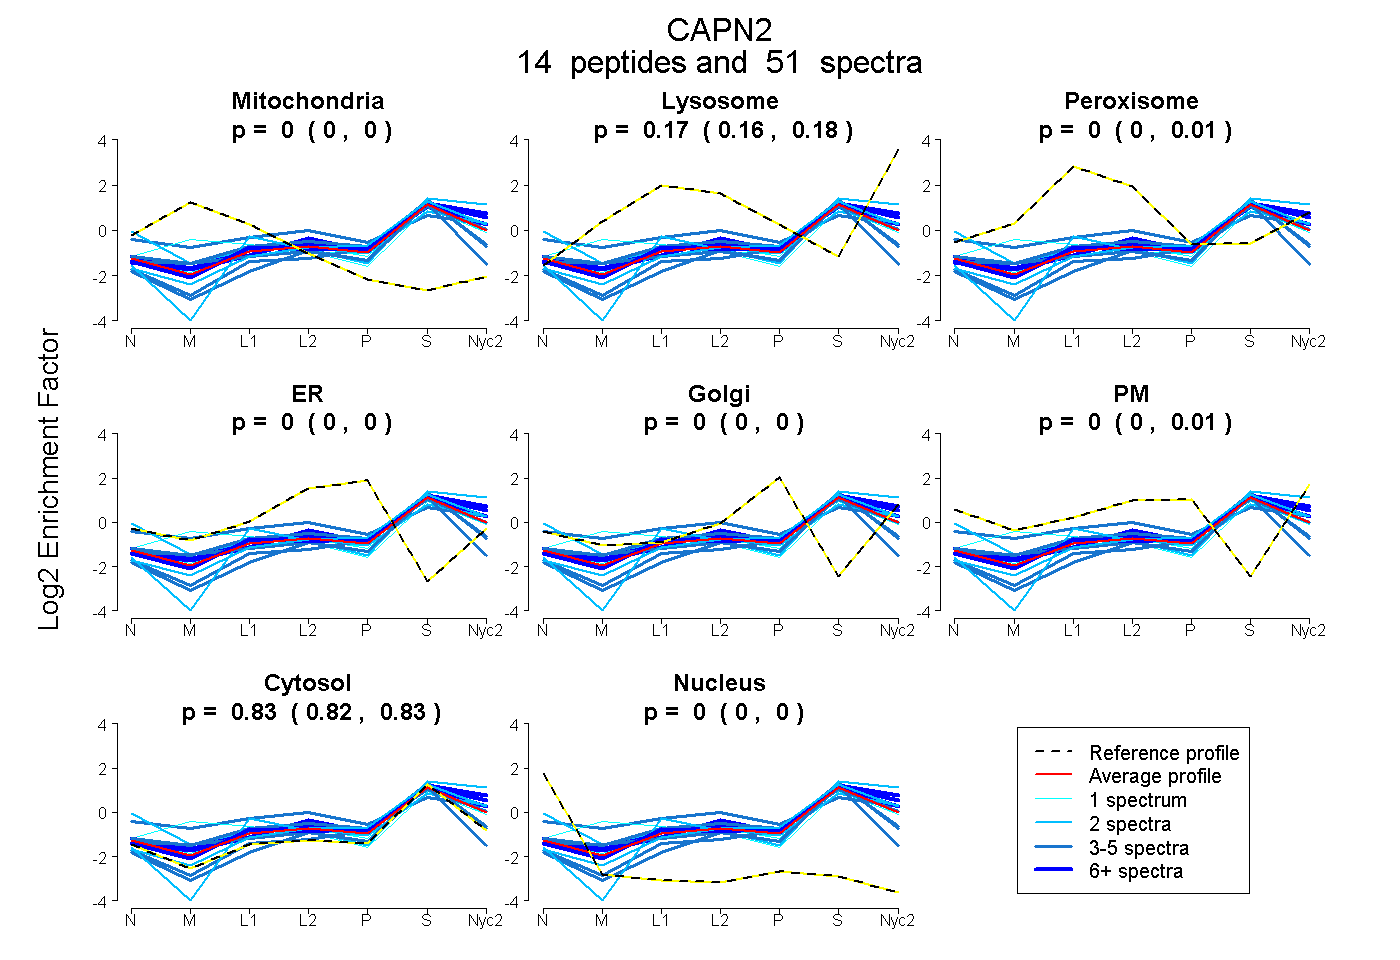
| Plot | Mito | Lyso | Perox | ER | Golgi | PM | Cytosol | Nucleus | |||||
| Expt A |
14 peptides |
51 spectra |
|
0.000 0.000 | 0.000 |
0.171 0.158 | 0.176 |
0.000 0.000 | 0.006 |
0.000 0.000 | 0.000 |
0.000 0.000 | 0.000 |
0.001 0.000 | 0.008 |
0.828 0.822 | 0.832 |
0.000 0.000 | 0.000 |
| 1 spectrum, KPPPNLFK | 0.000 | 0.145 | 0.000 | 0.000 | 0.000 | 0.000 | 0.855 | 0.000 | ||
| 6 spectra, NFFLTTR | 0.000 | 0.245 | 0.000 | 0.000 | 0.000 | 0.000 | 0.755 | 0.000 | ||
| 2 spectra, YLNQDYETLR | 0.000 | 0.160 | 0.000 | 0.000 | 0.000 | 0.000 | 0.840 | 0.000 | ||
| 4 spectra, NPWGQVEWTGK | 0.000 | 0.150 | 0.082 | 0.000 | 0.031 | 0.000 | 0.737 | 0.000 | ||
| 2 spectra, MDGNWR | 0.000 | 0.000 | 0.073 | 0.000 | 0.000 | 0.235 | 0.690 | 0.002 | ||
| 3 spectra, EAAEGLGSHER | 0.000 | 0.020 | 0.250 | 0.000 | 0.000 | 0.190 | 0.540 | 0.000 | ||
| 2 spectra, RPTEICADPQFIIGGATR | 0.000 | 0.160 | 0.000 | 0.000 | 0.000 | 0.000 | 0.840 | 0.000 | ||
| 1 spectrum, EFYILWTK | 0.187 | 0.170 | 0.007 | 0.000 | 0.000 | 0.000 | 0.636 | 0.000 | ||
| 3 spectra, LEILFK | 0.000 | 0.000 | 0.000 | 0.000 | 0.000 | 0.000 | 1.000 | 0.000 | ||
| 9 spectra, IMVDMLDEDGSGK | 0.000 | 0.199 | 0.000 | 0.000 | 0.000 | 0.029 | 0.772 | 0.000 | ||
| 4 spectra, SDGFSIETCK | 0.145 | 0.000 | 0.022 | 0.000 | 0.000 | 0.000 | 0.833 | 0.000 | ||
| 1 spectrum, DGDFCLR | 0.031 | 0.029 | 0.129 | 0.000 | 0.000 | 0.000 | 0.811 | 0.000 | ||
| 5 spectra, LPCQLHQVIVAR | 0.000 | 0.000 | 0.000 | 0.000 | 0.046 | 0.000 | 0.954 | 0.000 | ||
| 8 spectra, SGTMNSYEMR | 0.000 | 0.216 | 0.000 | 0.000 | 0.000 | 0.000 | 0.784 | 0.000 |
| Plot | Mito | Lyso or Perox | ER | Golgi | PM | Cytosol | Nucleus | ||||||
| Expt B |
6 peptides |
12 spectra |
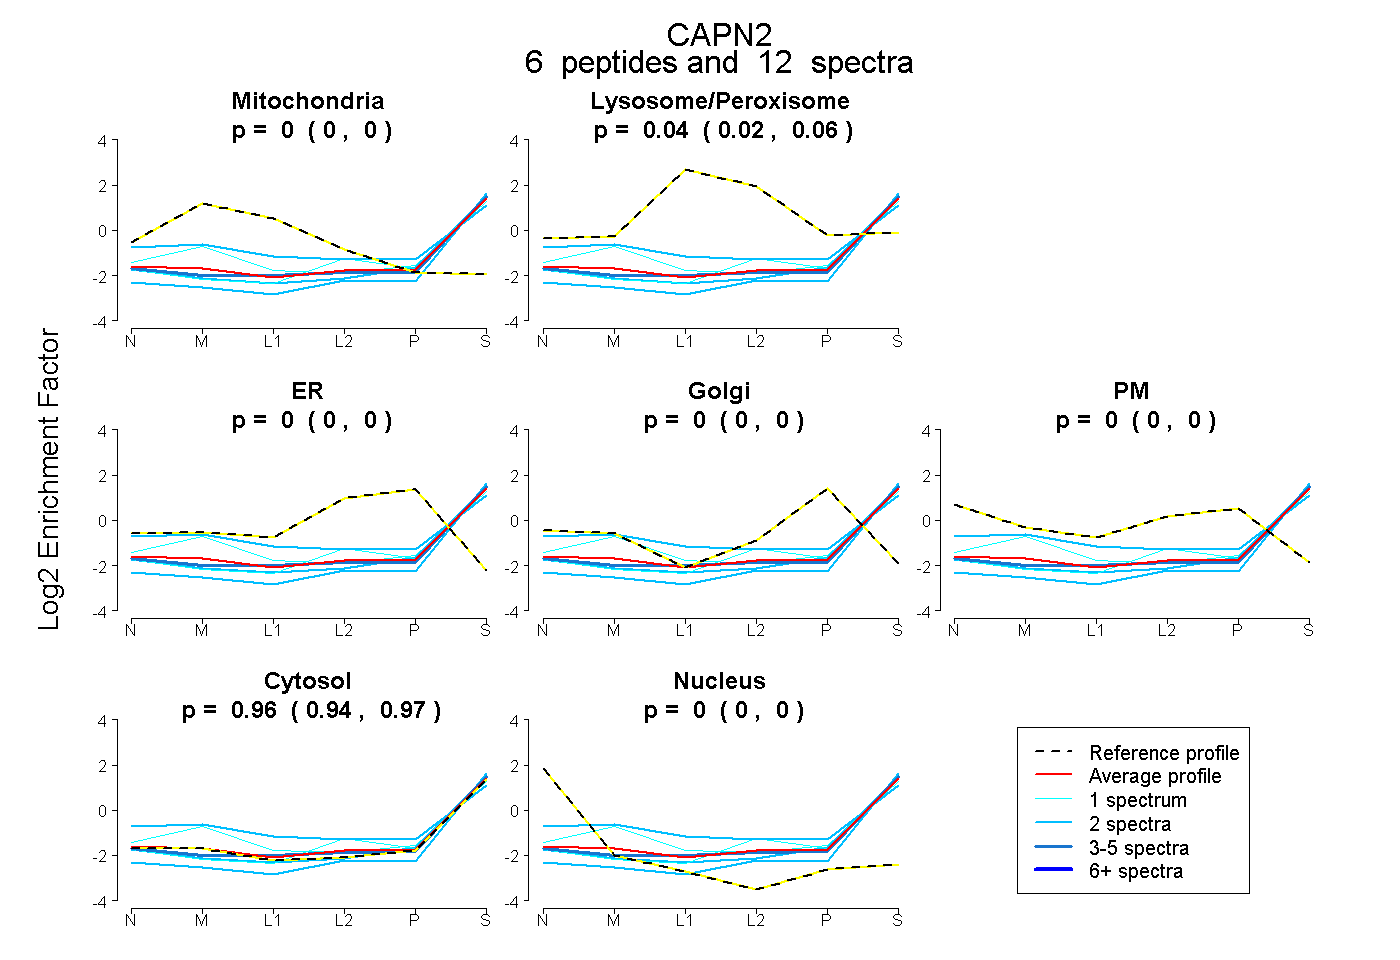 |
0.000 0.000 | 0.000 |
0.043 0.023 | 0.057 |
0.000 0.000 | 0.005 |
0.000 0.000 | 0.000 |
0.000 0.000 | 0.004 |
0.957 0.940 | 0.969 |
0.000 0.000 | 0.000 |
|||
| Plot | Lyso | Other | |||||||||||
| Expt C |
15 peptides |
48 spectra |
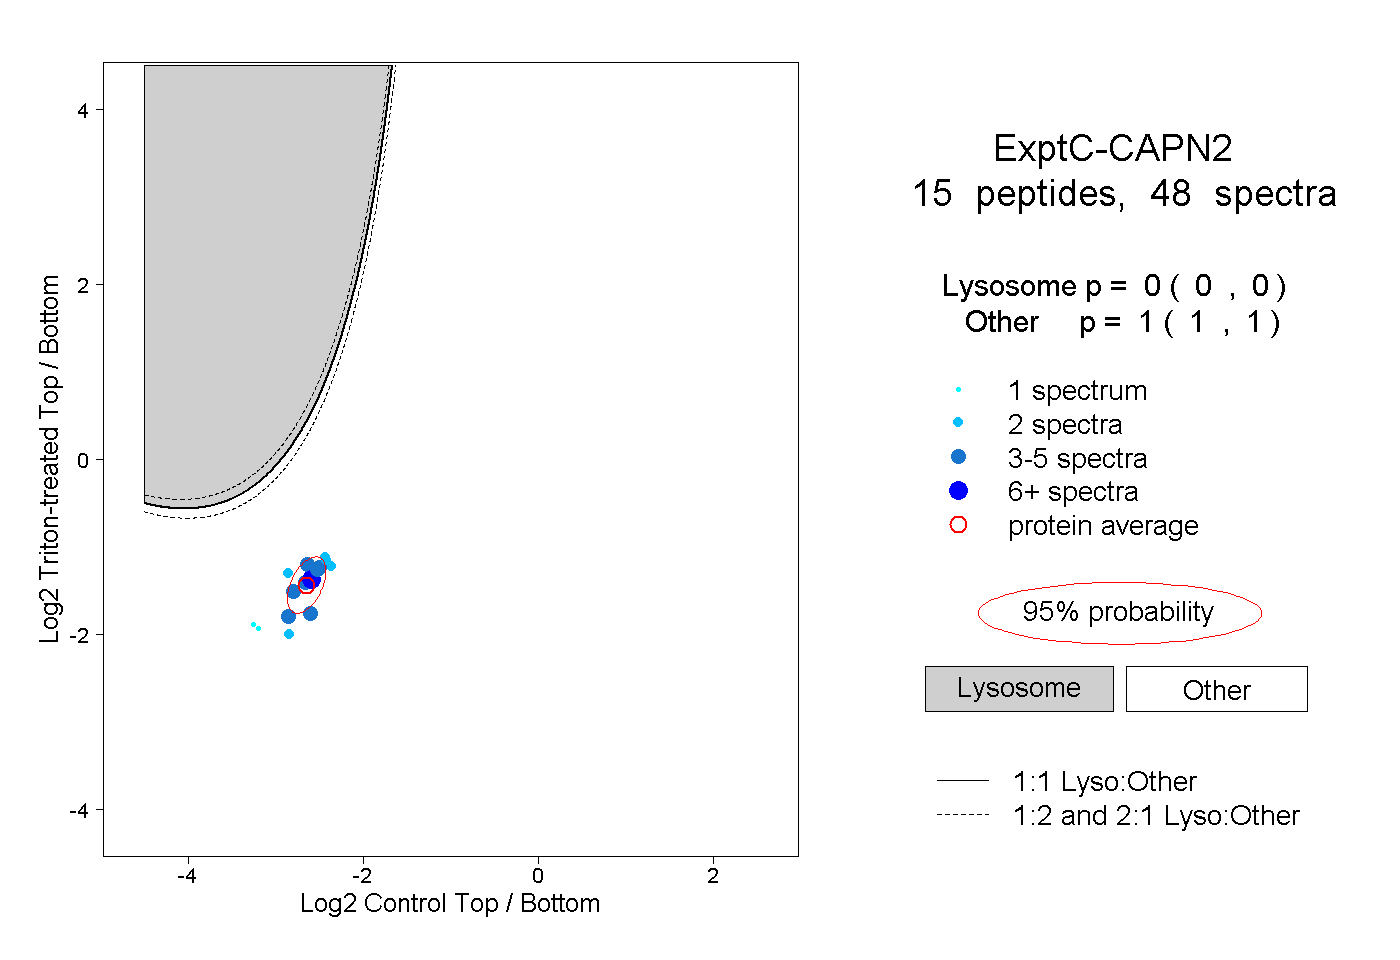 |
0.000 0.000 | 0.000 |
1.000 1.000 | 1.000 |
||||||||
| Plot | Lyso | Other | |||||||||||
| Expt D |
3 peptides |
4 spectra |
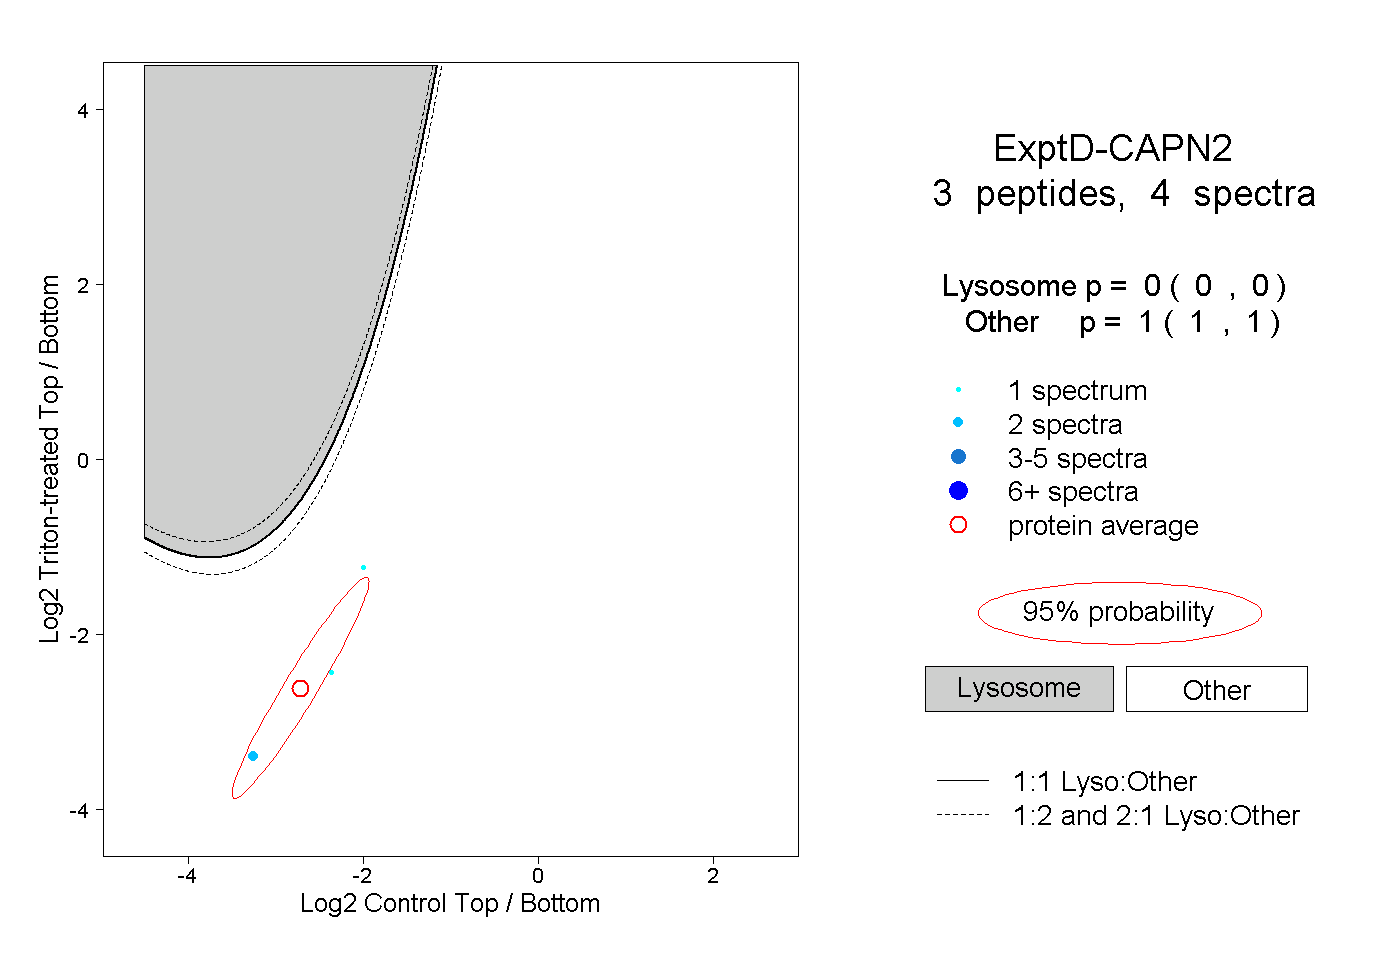 |
0.000 0.000 | 0.000 |
1.000 1.000 | 1.000 |