 6
6peptides
spectra
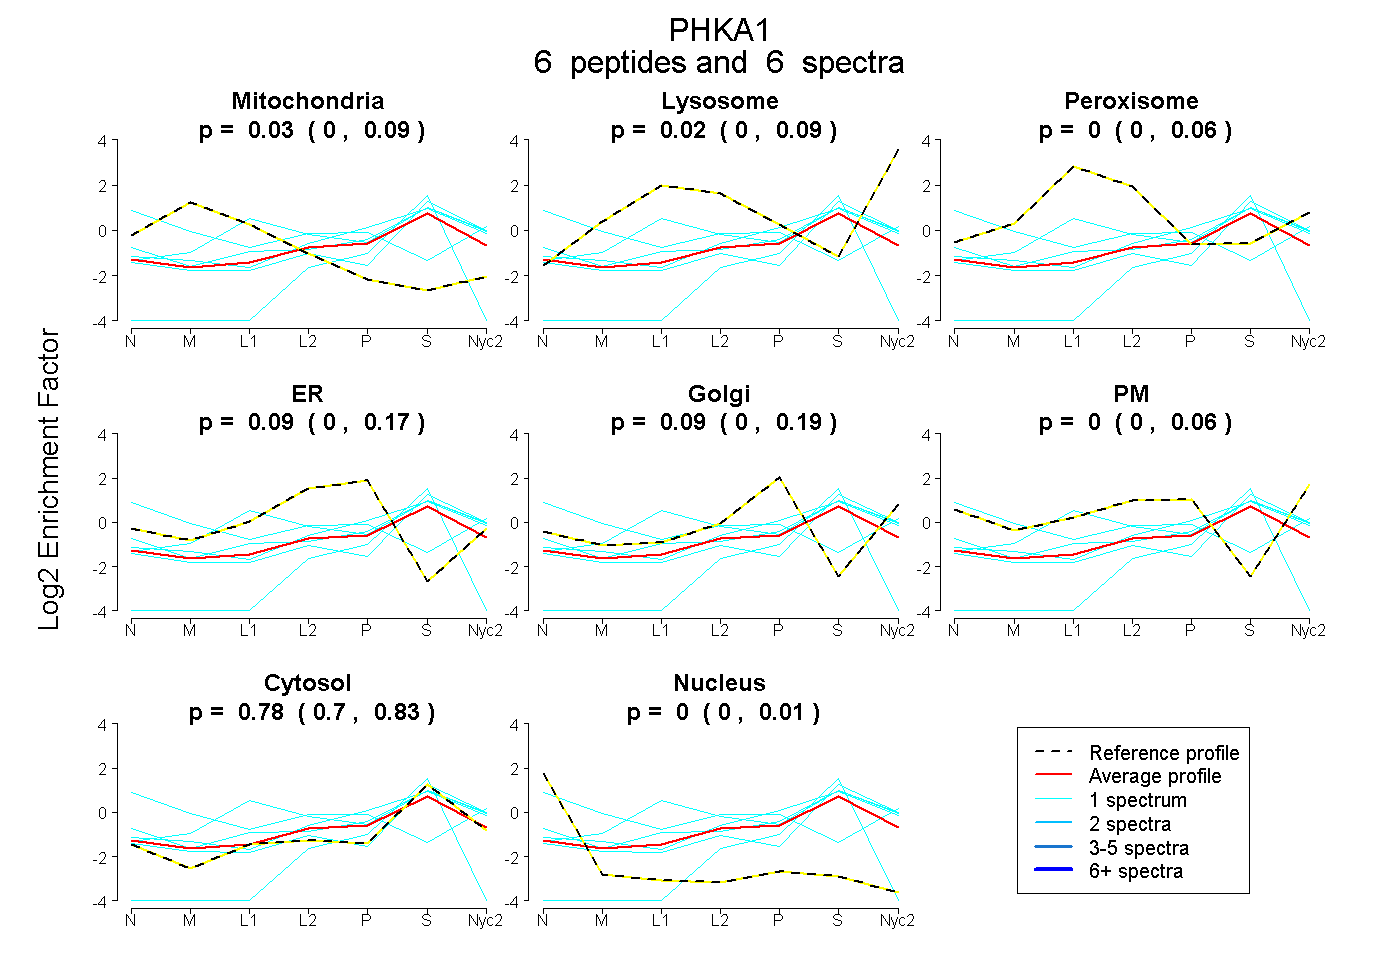
0.000 | 0.090
0.000 | 0.090
0.000 | 0.059
0.000 | 0.174
0.000 | 0.193
0.000 | 0.063
0.698 | 0.828
0.000 | 0.007
| Plot | Mito | Lyso | Perox | ER | Golgi | PM | Cytosol | Nucleus | |||||
| Expt A |
6 peptides |
6 spectra |
|
0.026 0.000 | 0.090 |
0.017 0.000 | 0.090 |
0.000 0.000 | 0.059 |
0.094 0.000 | 0.174 |
0.088 0.000 | 0.193 |
0.000 0.000 | 0.063 |
0.776 0.698 | 0.828 |
0.000 0.000 | 0.007 |
| 1 spectrum, VEVHLPR | 0.000 | 0.000 | 0.000 | 0.000 | 0.000 | 0.000 | 0.899 | 0.101 | ||
| 1 spectrum, HWGLIR | 0.000 | 0.090 | 0.000 | 0.000 | 0.000 | 0.000 | 0.910 | 0.000 | ||
| 1 spectrum, YSQSTK | 0.000 | 0.066 | 0.000 | 0.000 | 0.003 | 0.180 | 0.752 | 0.000 | ||
| 1 spectrum, HLTVGLPPEPR | 0.162 | 0.000 | 0.000 | 0.000 | 0.000 | 0.585 | 0.158 | 0.095 | ||
| 1 spectrum, YISGILR | 0.000 | 0.050 | 0.000 | 0.000 | 0.261 | 0.000 | 0.690 | 0.000 | ||
| 1 spectrum, NLLHHILSGK | 0.000 | 0.065 | 0.364 | 0.000 | 0.000 | 0.000 | 0.572 | 0.000 |
| Plot | Mito | Lyso or Perox | ER | Golgi | PM | Cytosol | Nucleus | ||||||
| Expt B |
1 peptide |
1 spectrum |
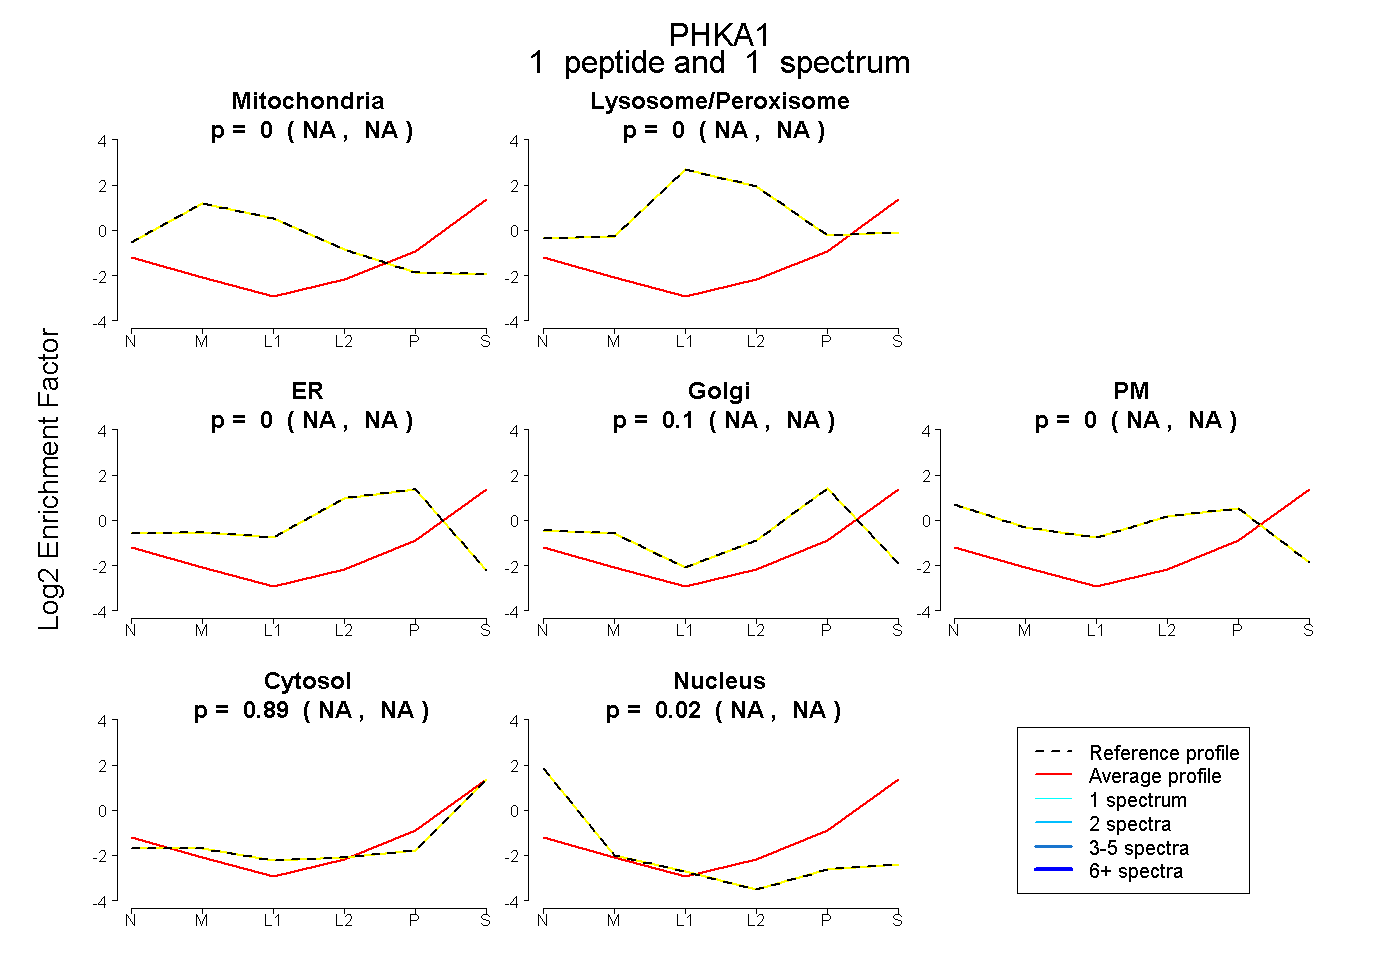 |
0.000 NA | NA |
0.000 NA | NA |
0.000 NA | NA |
0.098 NA | NA |
0.000 NA | NA |
0.885 NA | NA |
0.017 NA | NA |
|||
| Plot | Lyso | Other | |||||||||||
| Expt C |
4 peptides |
17 spectra |
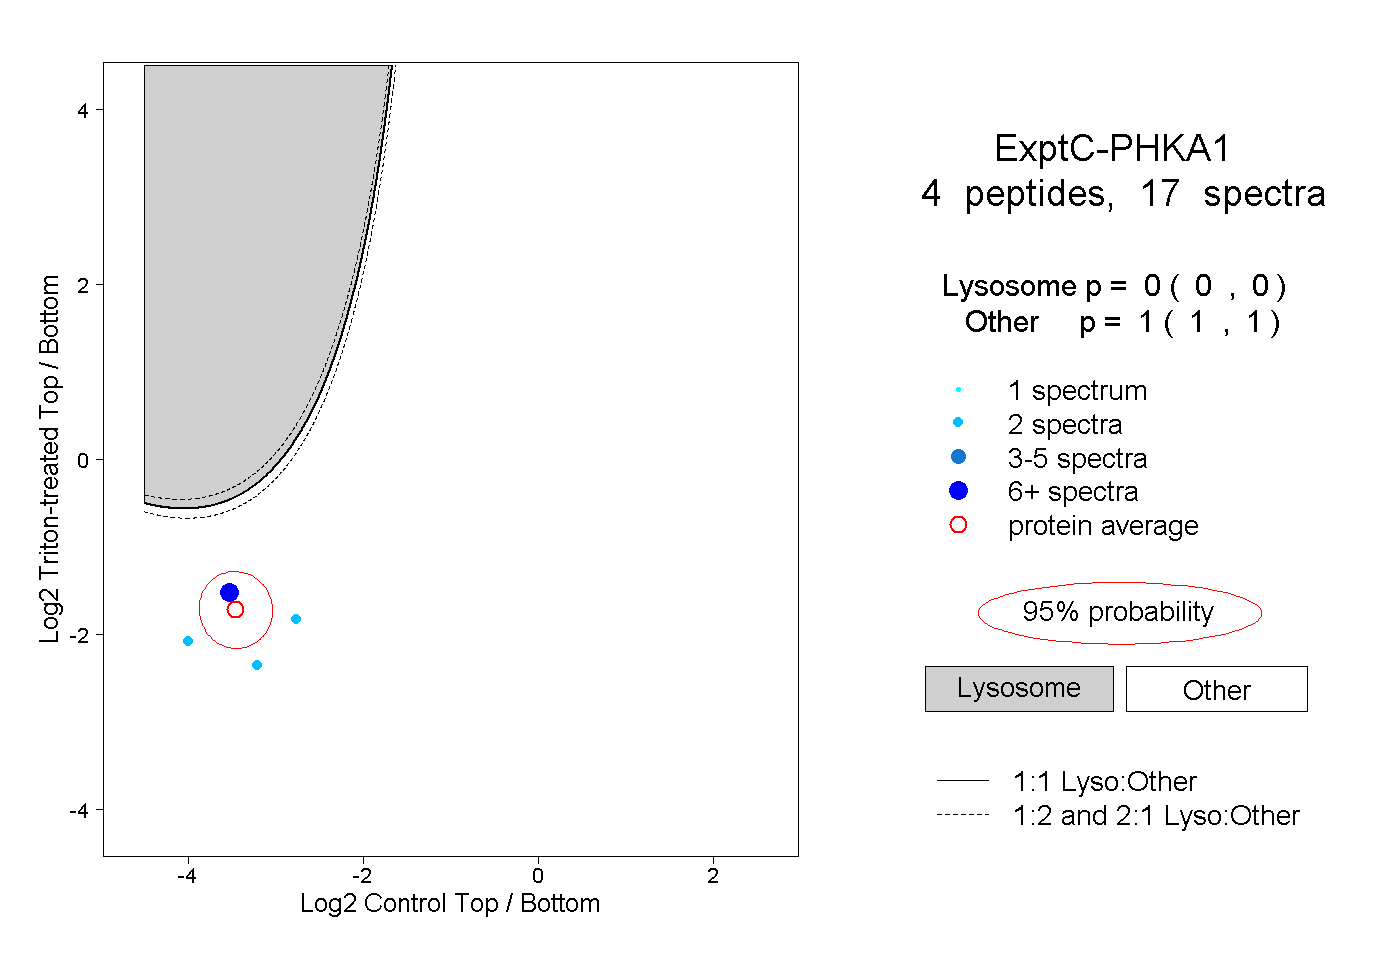 |
0.000 0.000 | 0.000 |
1.000 1.000 | 1.000 |