 4
4peptides
spectra
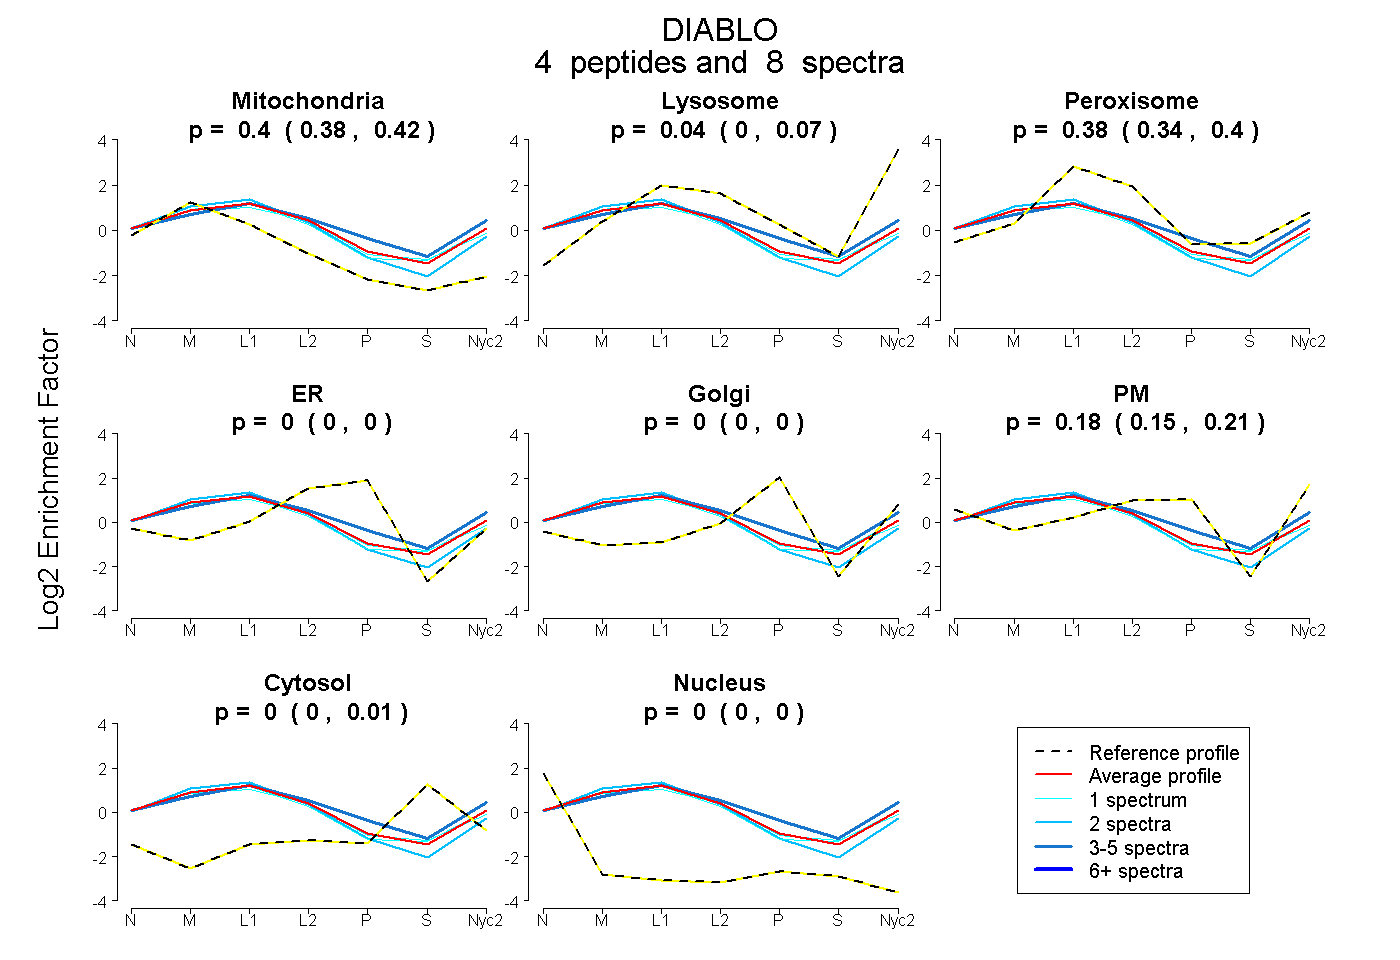
0.376 | 0.420
0.003 | 0.071
0.340 | 0.404
0.000 | 0.000
0.000 | 0.000
0.146 | 0.207
0.000 | 0.014
0.000 | 0.000
3peptides
spectra
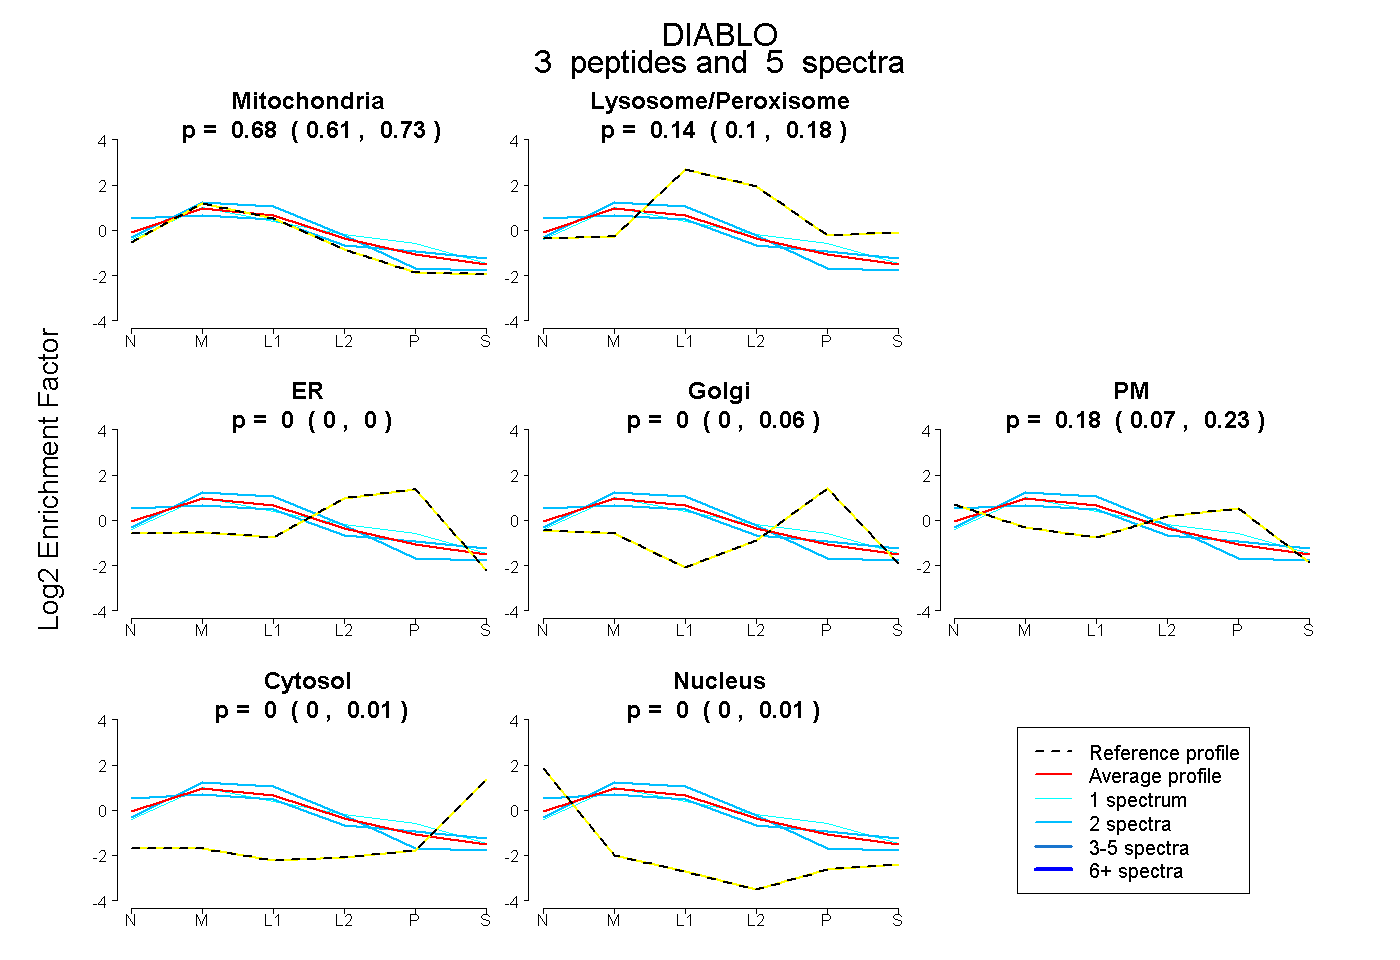
0.612 | 0.730
0.097 | 0.177
0.000 | 0.000
0.000 | 0.063
0.067 | 0.235
0.000 | 0.007
0.000 | 0.014
9peptides
spectra
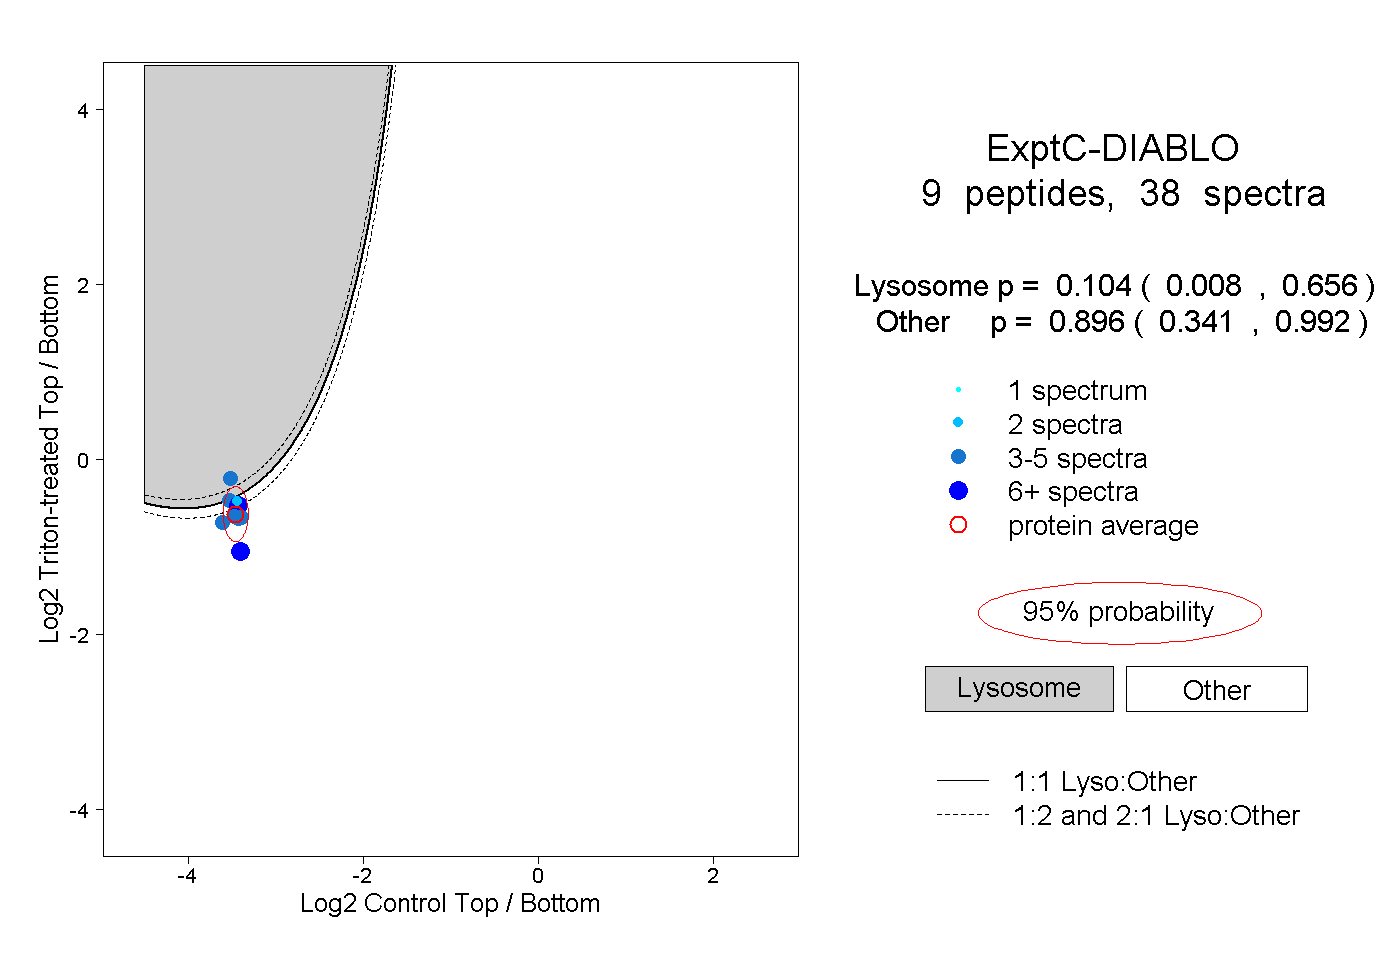
0.008 | 0.656
0.341 | 0.992
1peptide
spectrum
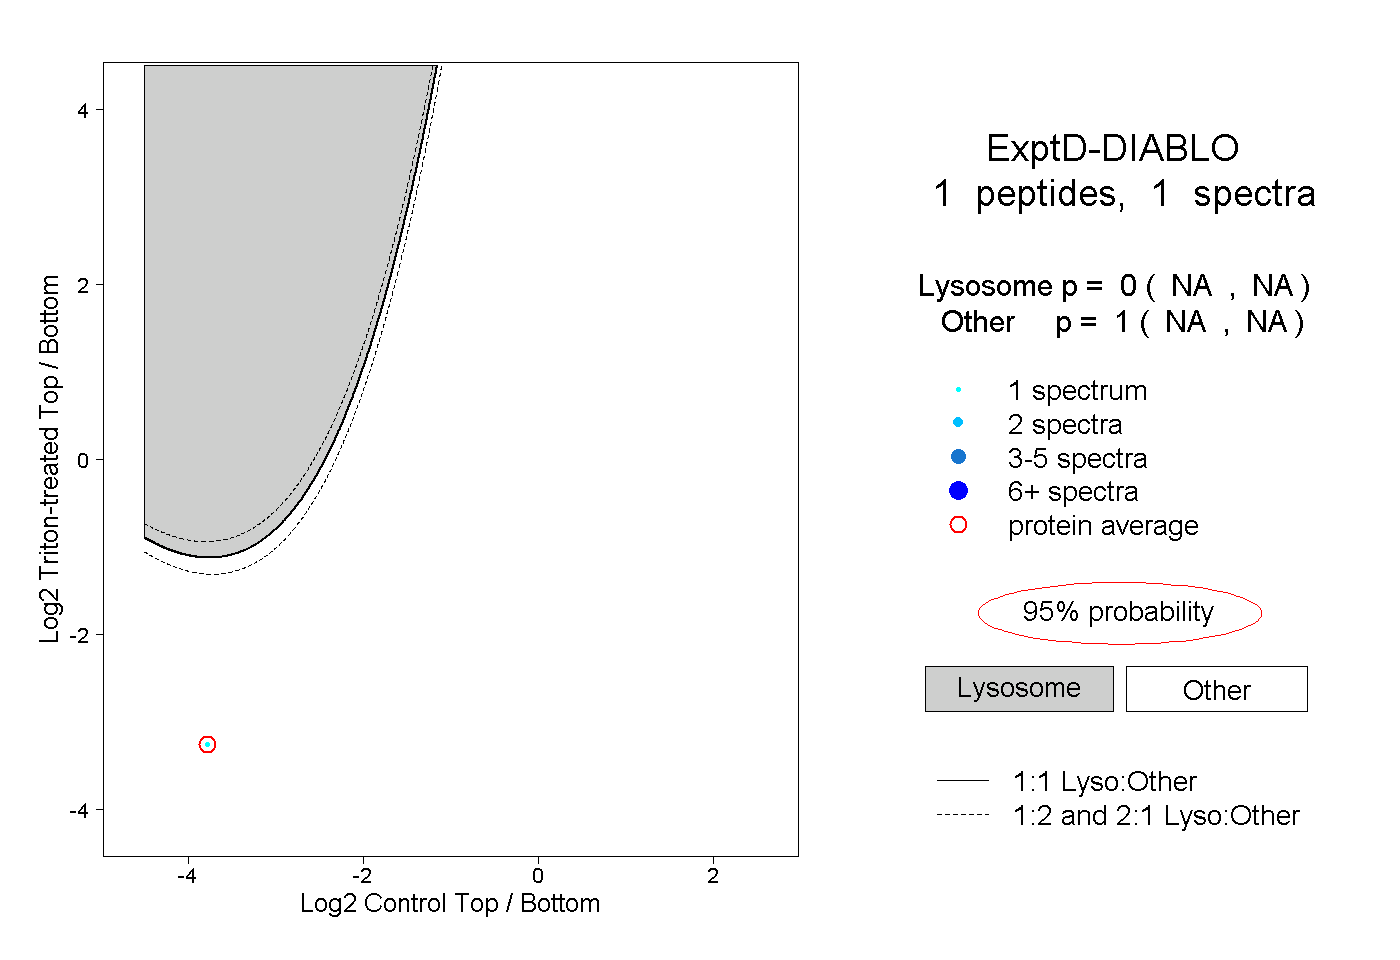
NA | NA
NA | NA