 1
1peptide
spectra
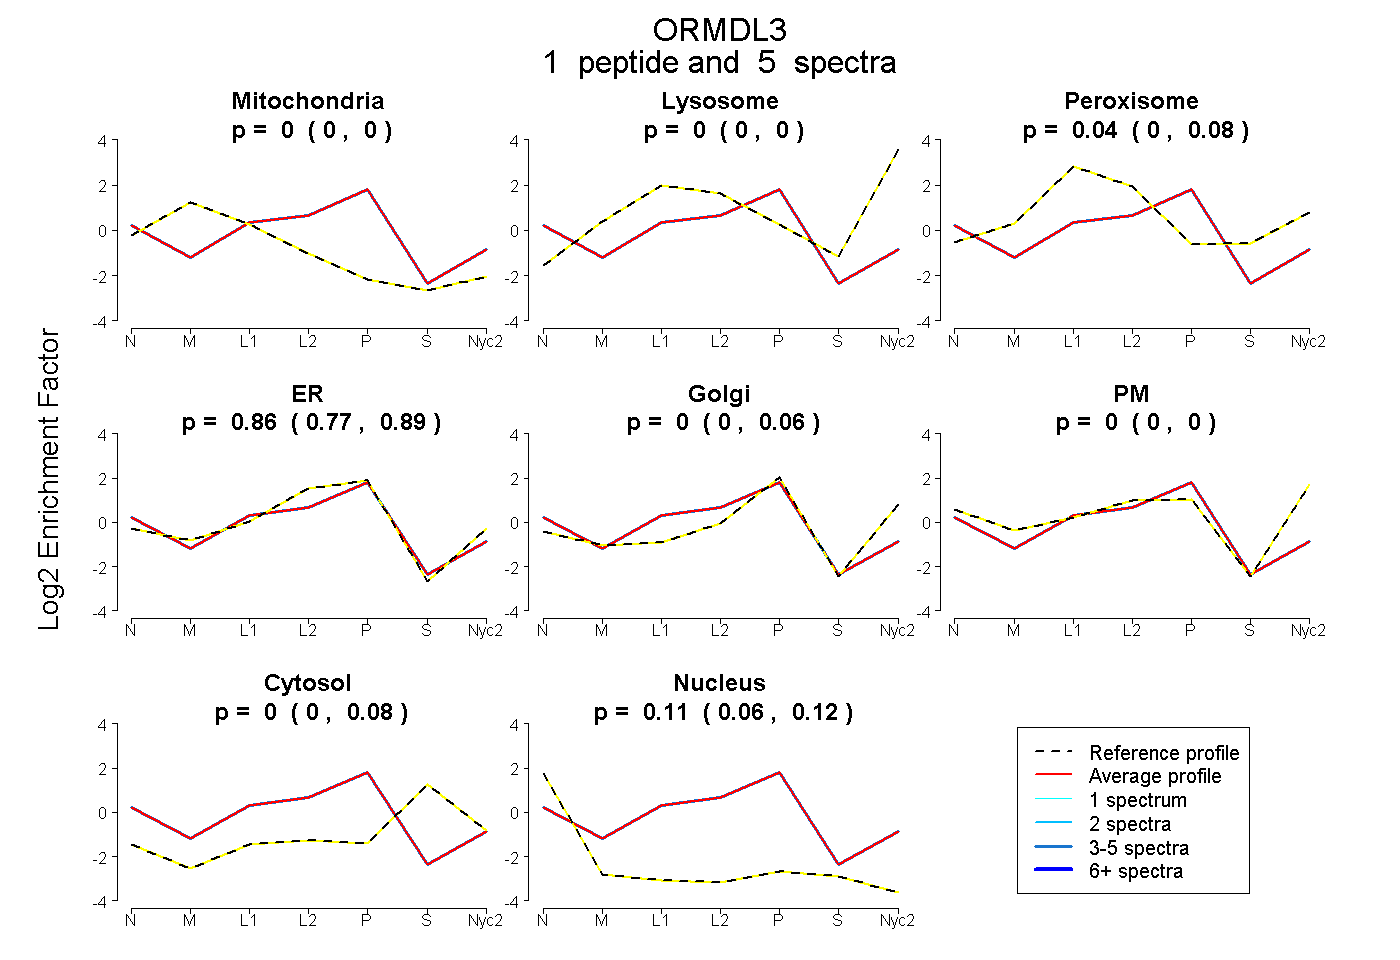
0.000 | 0.000
0.000 | 0.000
0.000 | 0.075
0.765 | 0.893
0.000 | 0.065
0.000 | 0.000
0.000 | 0.081
0.057 | 0.117
1peptide
spectra
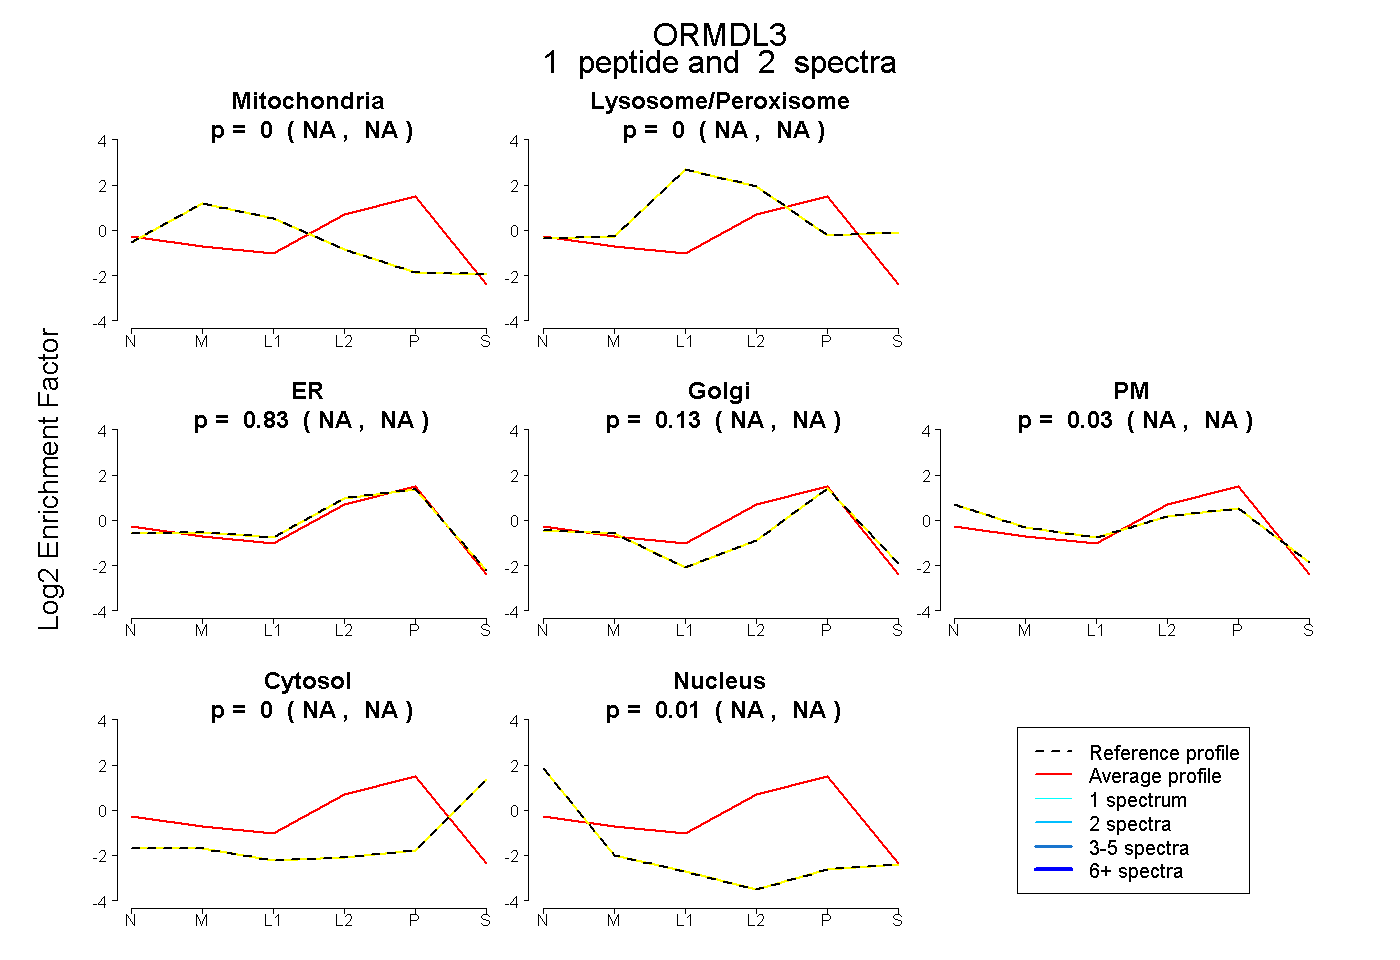
NA | NA
NA | NA
NA | NA
NA | NA
NA | NA
NA | NA
NA | NA
1peptide
spectra
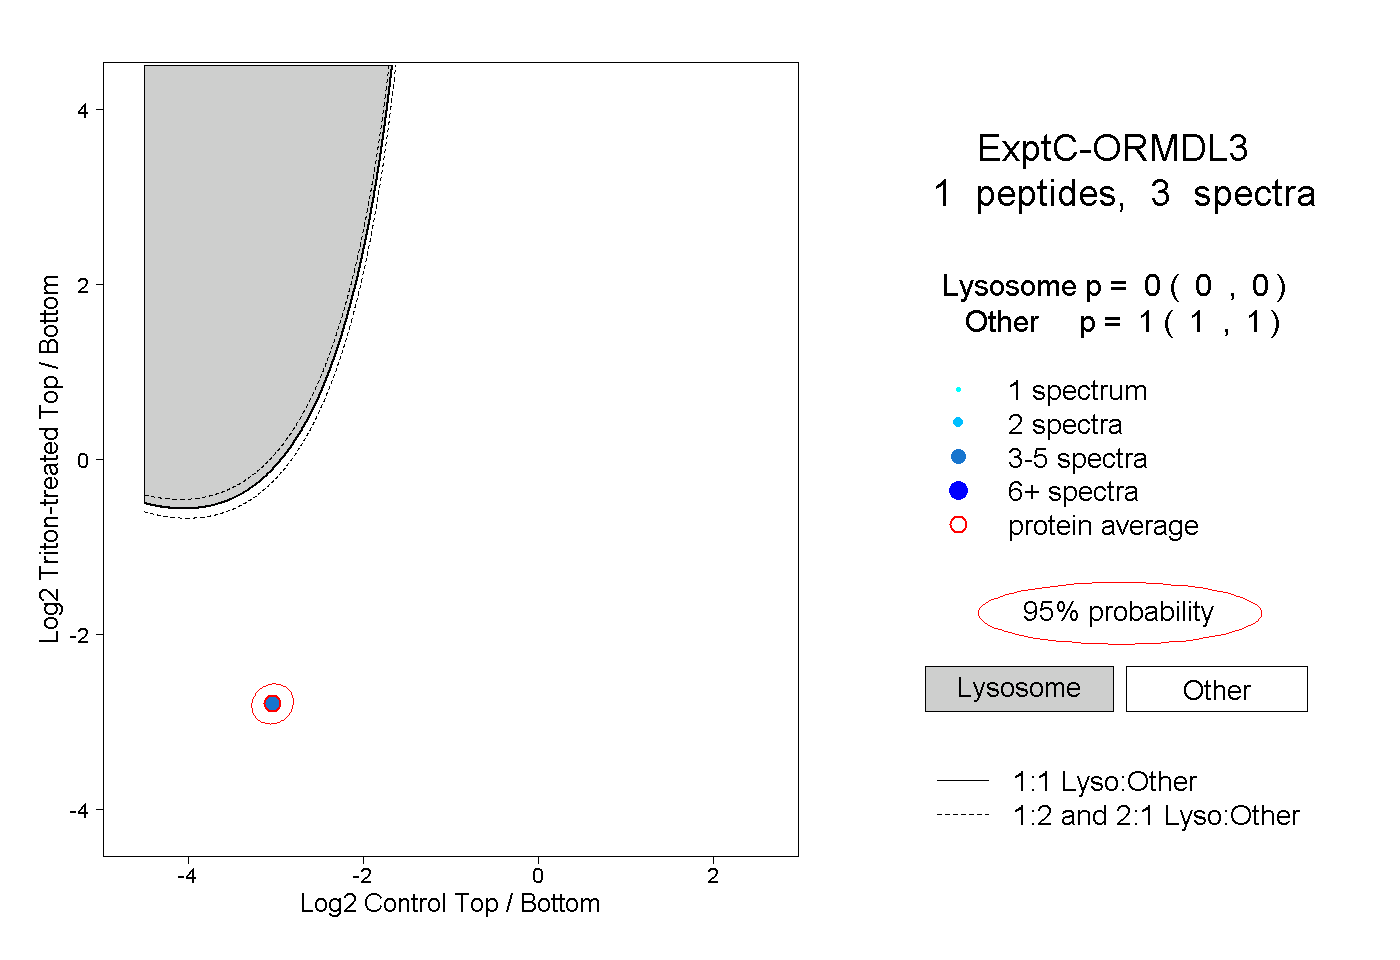
0.000 | 0.000
1.000 | 1.000