 3
3peptides
spectra
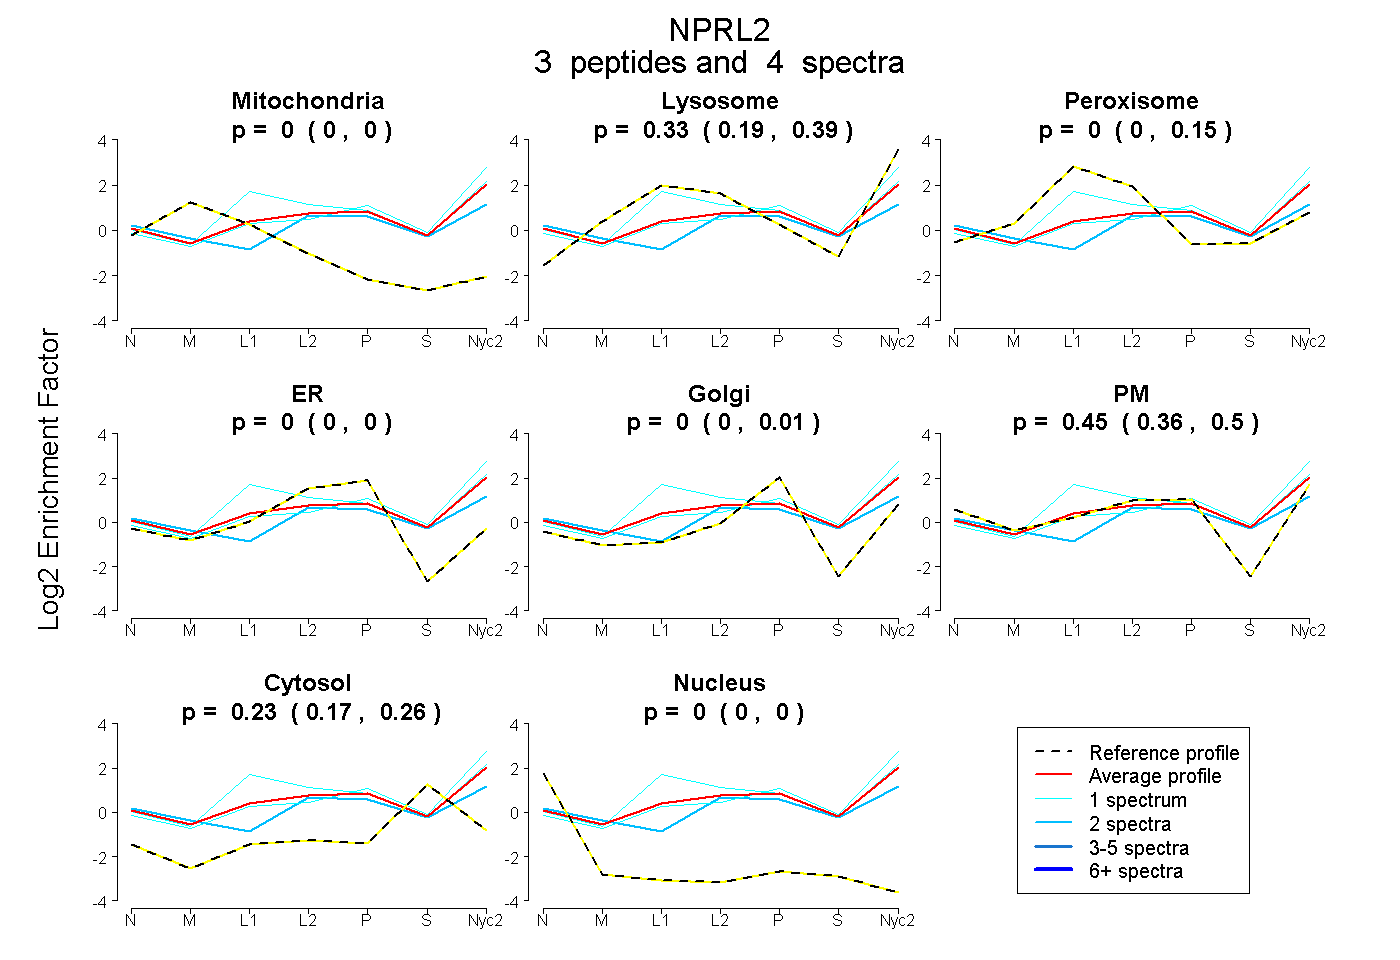
0.000 | 0.000
0.195 | 0.394
0.000 | 0.150
0.000 | 0.000
0.000 | 0.008
0.359 | 0.502
0.167 | 0.256
0.000 | 0.000
| Plot | Mito | Lyso | Perox | ER | Golgi | PM | Cytosol | Nucleus | |||||
| Expt A |
3 peptides |
4 spectra |
|
0.000 0.000 | 0.000 |
0.328 0.195 | 0.394 |
0.000 0.000 | 0.150 |
0.000 0.000 | 0.000 |
0.000 0.000 | 0.008 |
0.446 0.359 | 0.502 |
0.226 0.167 | 0.256 |
0.000 0.000 | 0.000 |
| 1 spectrum, LENDPNIIICWK | 0.000 | 0.342 | 0.262 | 0.000 | 0.000 | 0.295 | 0.101 | 0.000 | ||
| 2 spectra, HPQQLQHVDER | 0.000 | 0.062 | 0.000 | 0.000 | 0.000 | 0.613 | 0.325 | 0.000 | ||
| 1 spectrum, VQDLVDDK | 0.000 | 0.445 | 0.000 | 0.000 | 0.109 | 0.252 | 0.194 | 0.000 |
| Plot | Lyso | Other | |||||||||||
| Expt C |
2 peptides |
4 spectra |
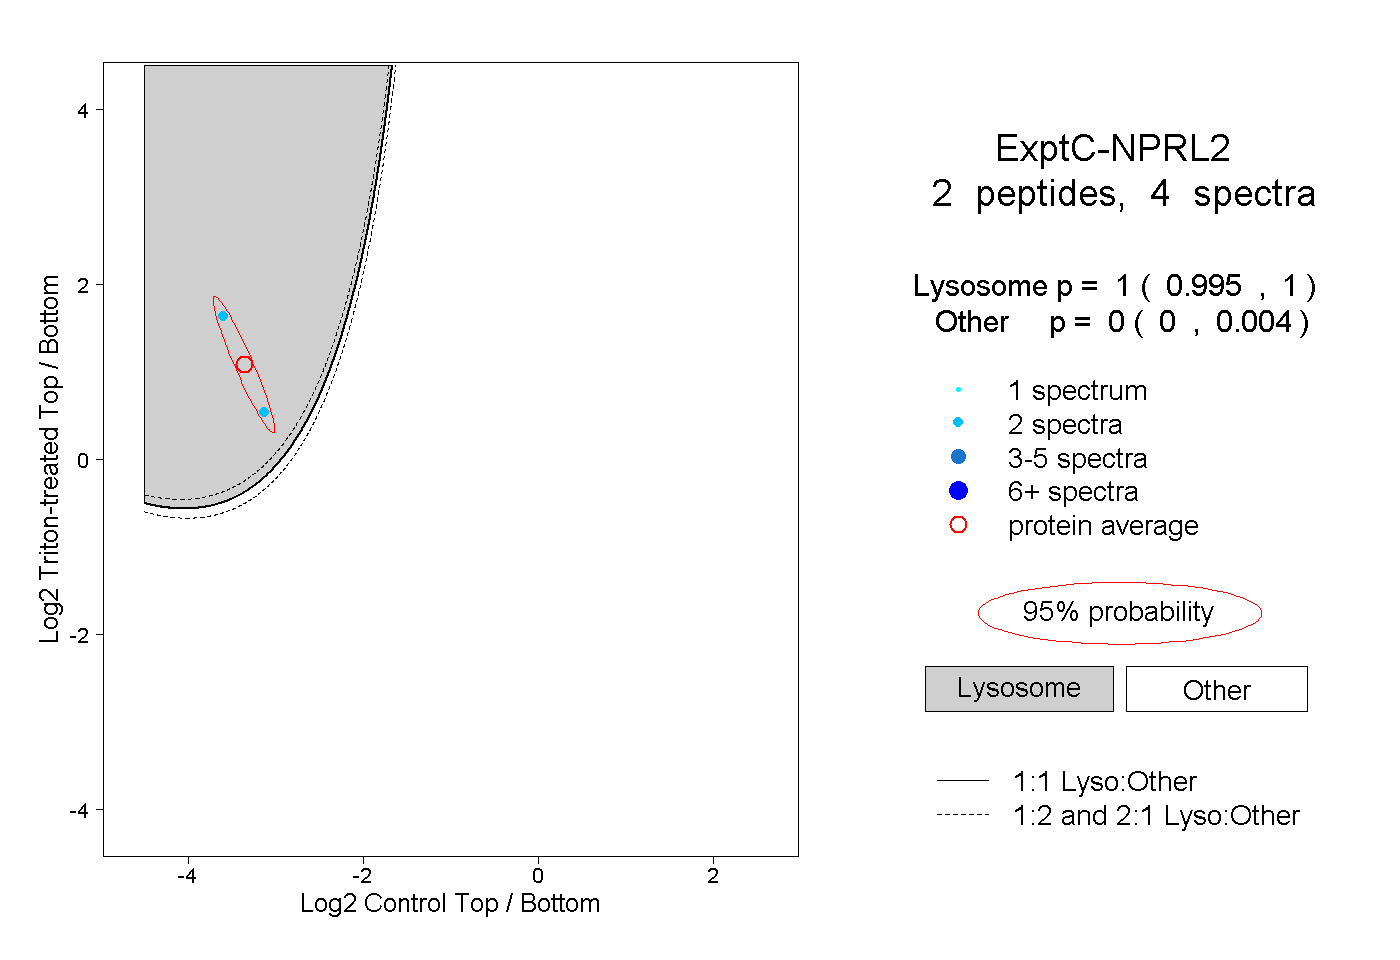 |
1.000 0.995 | 1.000 |
0.000 0.000 | 0.004 |