10
10peptides
spectra
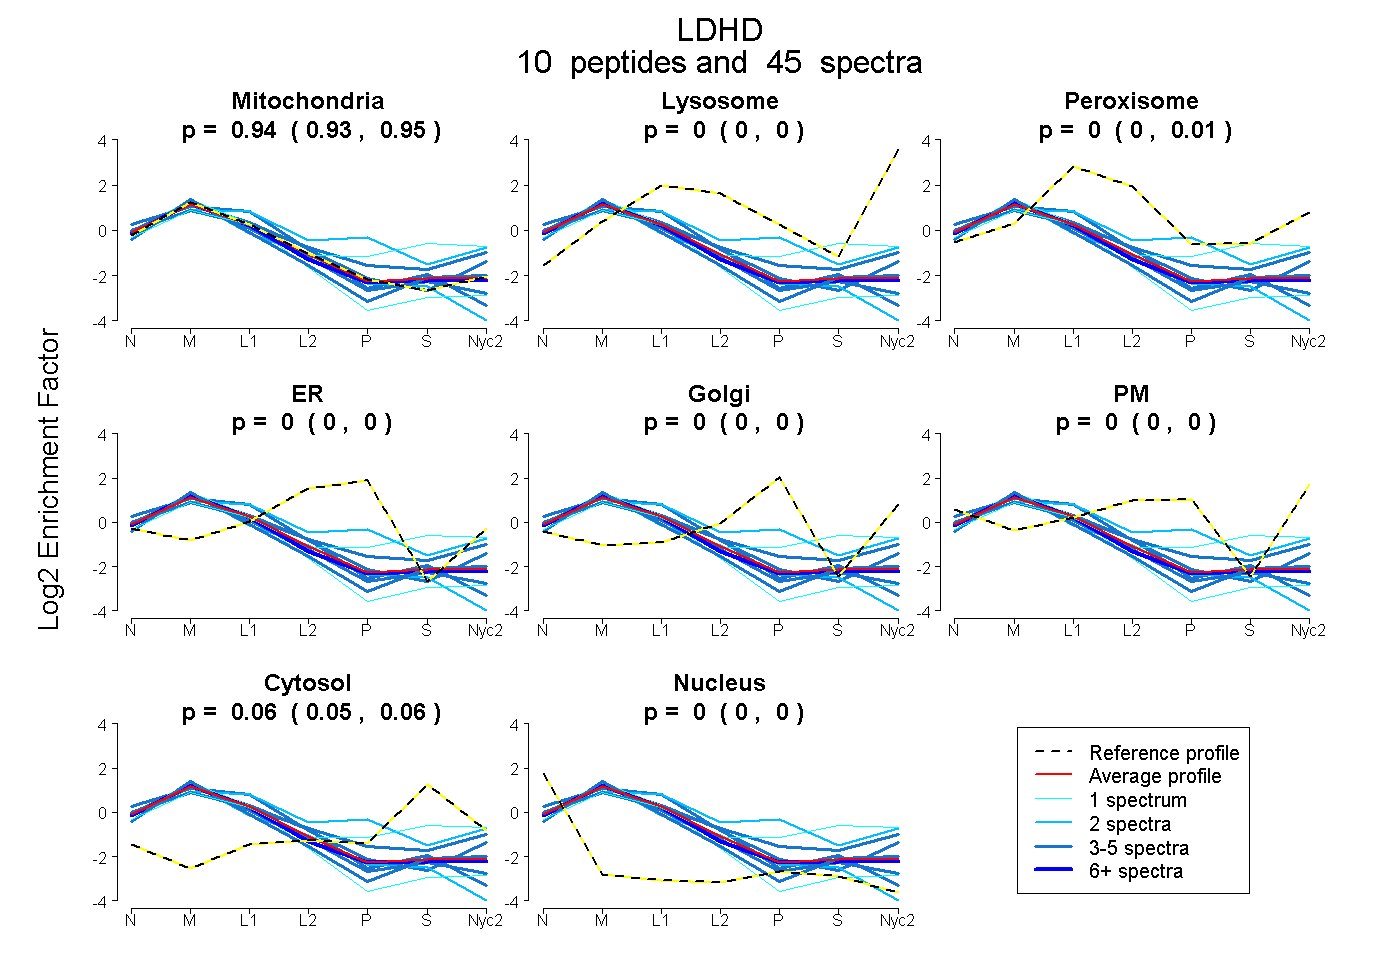
0.928 | 0.946
0.000 | 0.000
0.000 | 0.010
0.000 | 0.000
0.000 | 0.000
0.000 | 0.000
0.051 | 0.062
0.000 | 0.003
6peptides
spectra
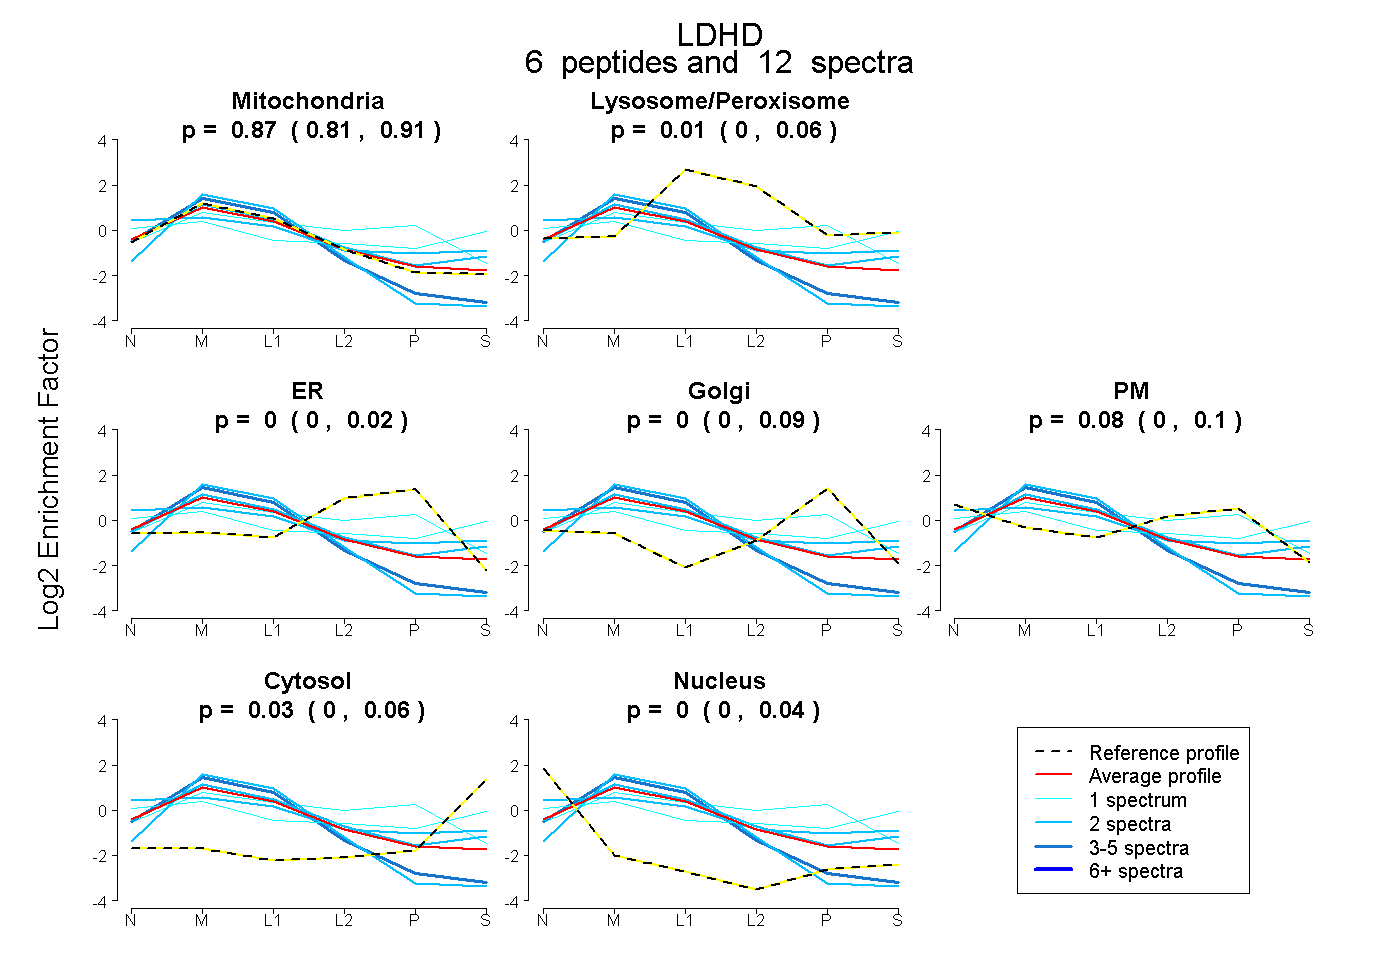
0.805 | 0.915
0.000 | 0.062
0.000 | 0.016
0.000 | 0.093
0.000 | 0.103
0.000 | 0.063
0.000 | 0.041