 10
10peptides
spectra
0.928 | 0.946
0.000 | 0.000
0.000 | 0.010
0.000 | 0.000
0.000 | 0.000
0.000 | 0.000
0.051 | 0.062
0.000 | 0.003
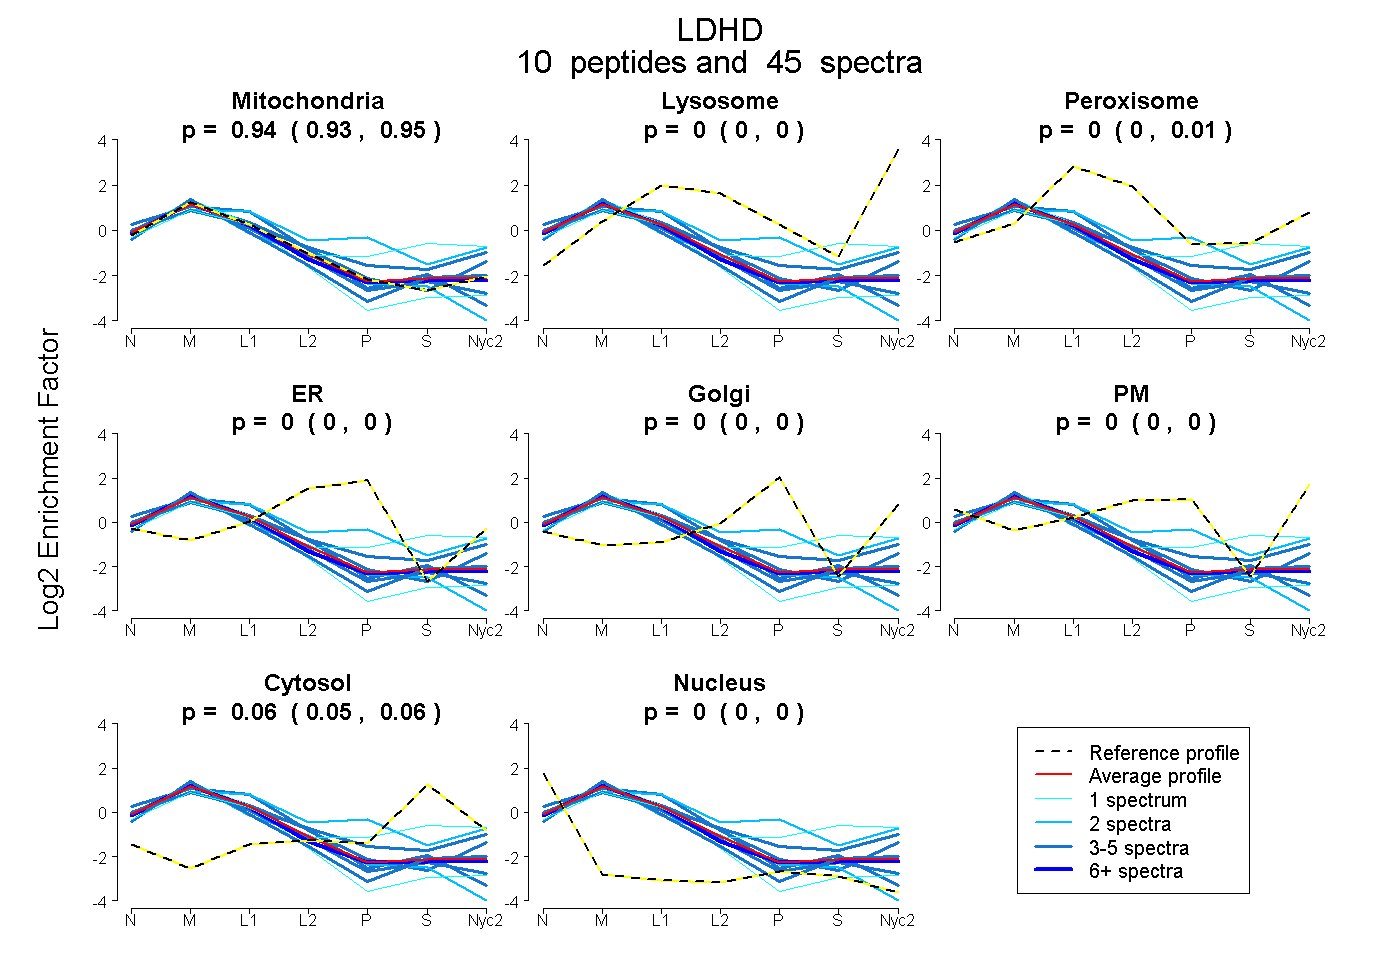
| Plot | Mito | Lyso | Perox | ER | Golgi | PM | Cytosol | Nucleus | |||||
| Expt A |
10 peptides |
45 spectra |
|
0.940 0.928 | 0.946 |
0.000 0.000 | 0.000 |
0.002 0.000 | 0.010 |
0.000 0.000 | 0.000 |
0.000 0.000 | 0.000 |
0.000 0.000 | 0.000 |
0.058 0.051 | 0.062 |
0.000 0.000 | 0.003 |
| 3 spectra, ALNTHLR | 0.942 | 0.000 | 0.000 | 0.000 | 0.000 | 0.000 | 0.000 | 0.058 | ||
| 3 spectra, ALALHGTCTGEHGIGLGK | 0.853 | 0.000 | 0.098 | 0.000 | 0.000 | 0.045 | 0.000 | 0.005 | ||
| 1 spectrum, TEAITQDNGGSHFSWAK | 0.550 | 0.138 | 0.058 | 0.000 | 0.000 | 0.000 | 0.254 | 0.000 | ||
| 5 spectra, IEFLDEVMMDACNR | 0.926 | 0.000 | 0.000 | 0.000 | 0.000 | 0.000 | 0.000 | 0.074 | ||
| 2 spectra, CRPPDAVVWPQNVDQVSR | 0.881 | 0.000 | 0.000 | 0.000 | 0.000 | 0.000 | 0.000 | 0.119 | ||
| 19 spectra, LLHTAGR | 0.944 | 0.000 | 0.000 | 0.000 | 0.000 | 0.000 | 0.035 | 0.020 | ||
| 5 spectra, QLLQEEVGPVGVETMR | 0.688 | 0.029 | 0.062 | 0.000 | 0.000 | 0.117 | 0.104 | 0.000 | ||
| 1 spectrum, DNVINLEVVLPDGR | 0.921 | 0.000 | 0.000 | 0.000 | 0.000 | 0.000 | 0.000 | 0.079 | ||
| 2 spectra, AVVGSPHVSTASAVR | 0.495 | 0.000 | 0.270 | 0.000 | 0.228 | 0.000 | 0.007 | 0.000 | ||
| 4 spectra, NELWAAR | 0.931 | 0.000 | 0.000 | 0.000 | 0.000 | 0.000 | 0.041 | 0.028 |
| Plot | Mito | Lyso or Perox | ER | Golgi | PM | Cytosol | Nucleus | ||||||
| Expt B |
6 peptides |
12 spectra |
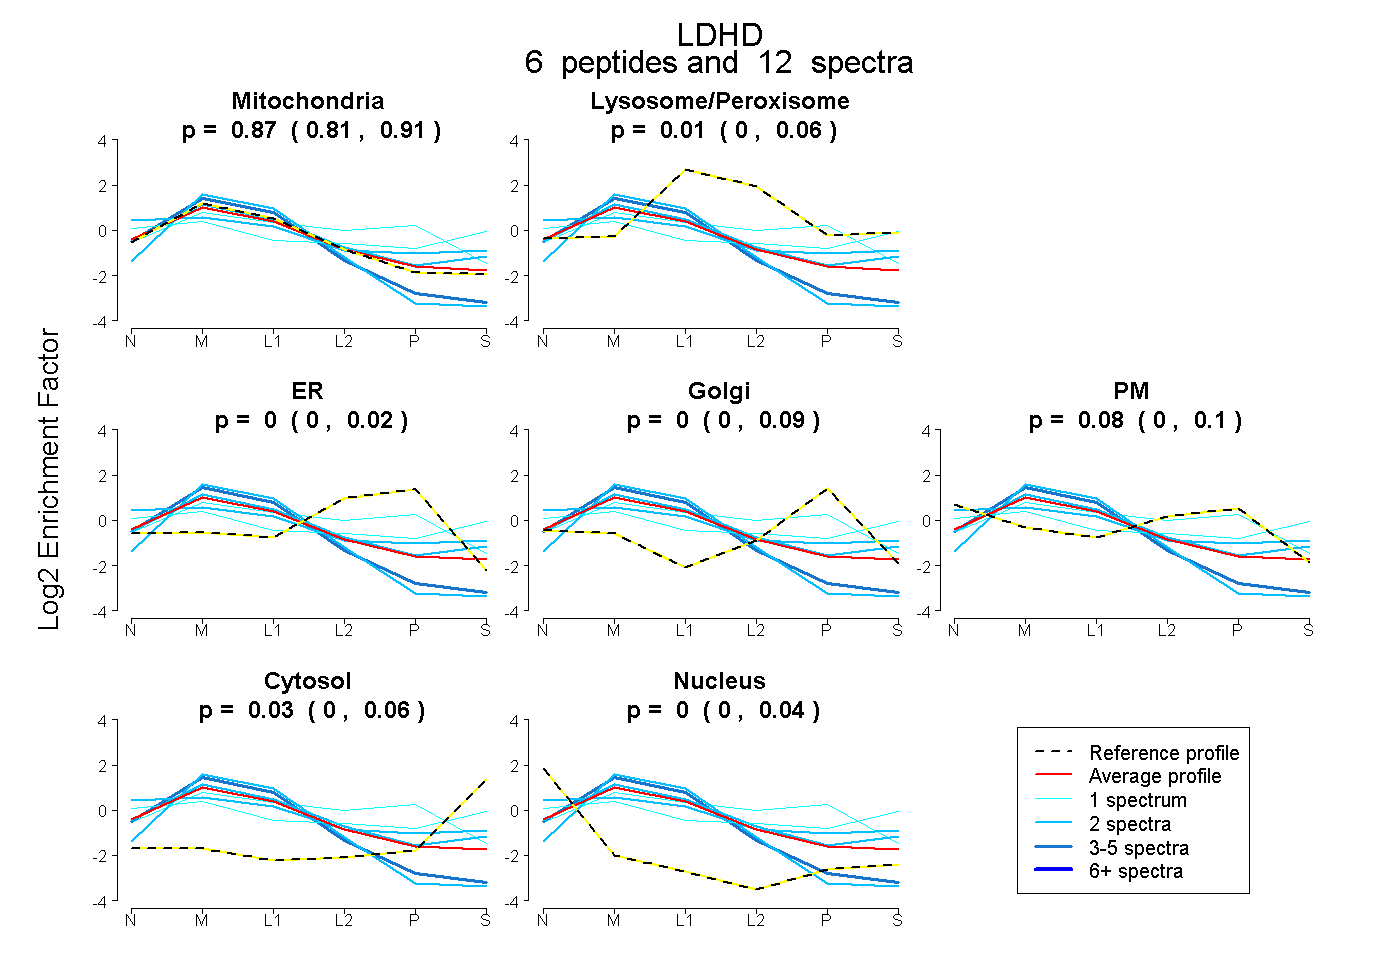 |
0.873 0.805 | 0.915 |
0.012 0.000 | 0.062 |
0.000 0.000 | 0.016 |
0.000 0.000 | 0.093 |
0.082 0.000 | 0.103 |
0.032 0.000 | 0.063 |
0.001 0.000 | 0.041 |
|||
| Plot | Lyso | Other | |||||||||||
| Expt C |
8 peptides |
76 spectra |
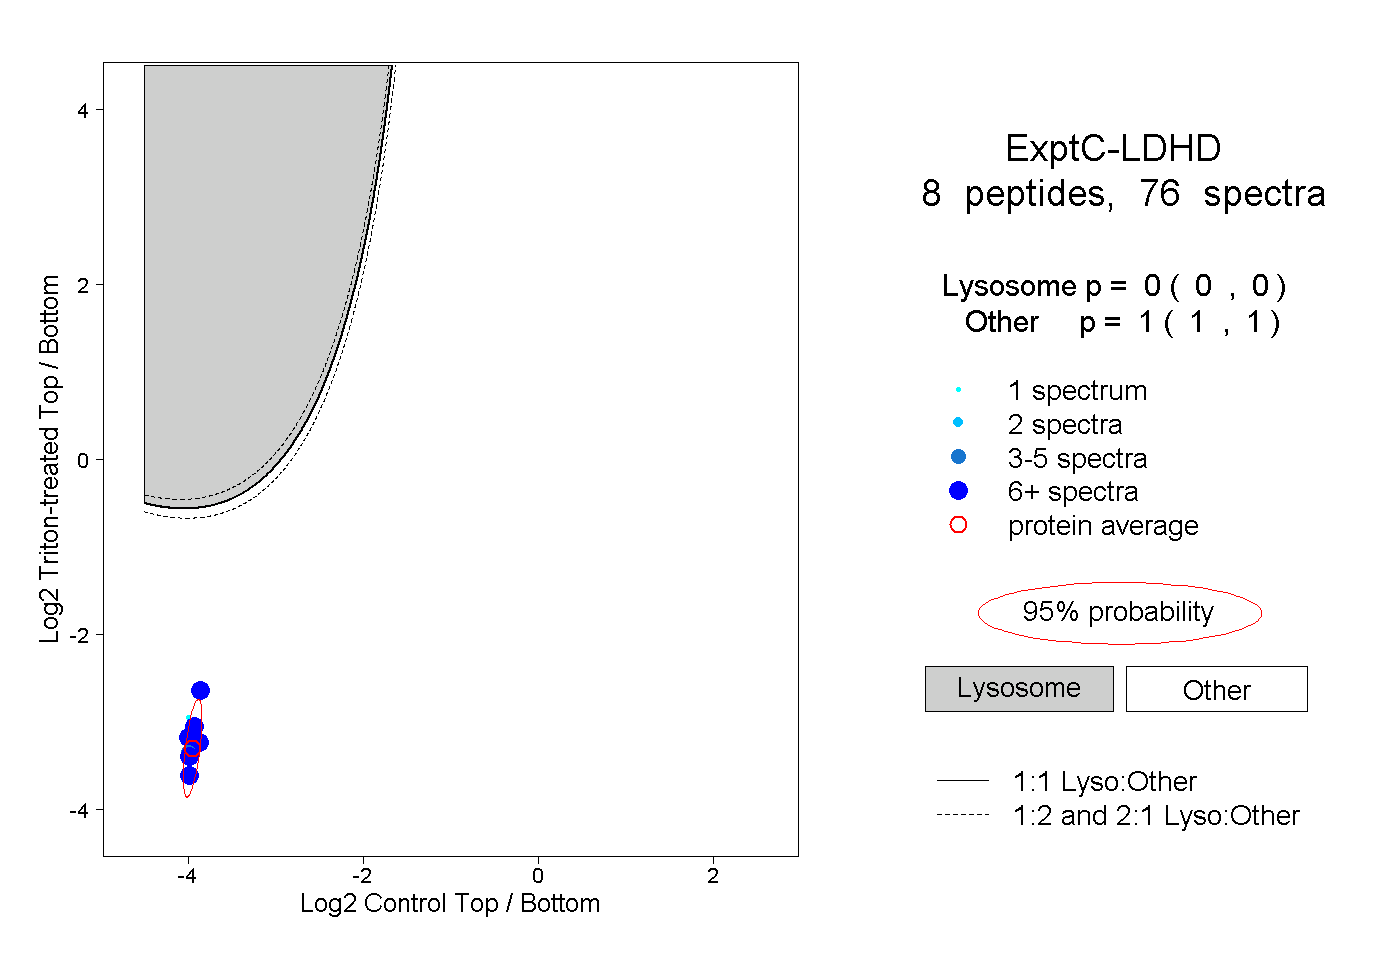 |
0.000 0.000 | 0.000 |
1.000 1.000 | 1.000 |
||||||||
| Plot | Lyso | Other | |||||||||||
| Expt D |
5 peptides |
13 spectra |
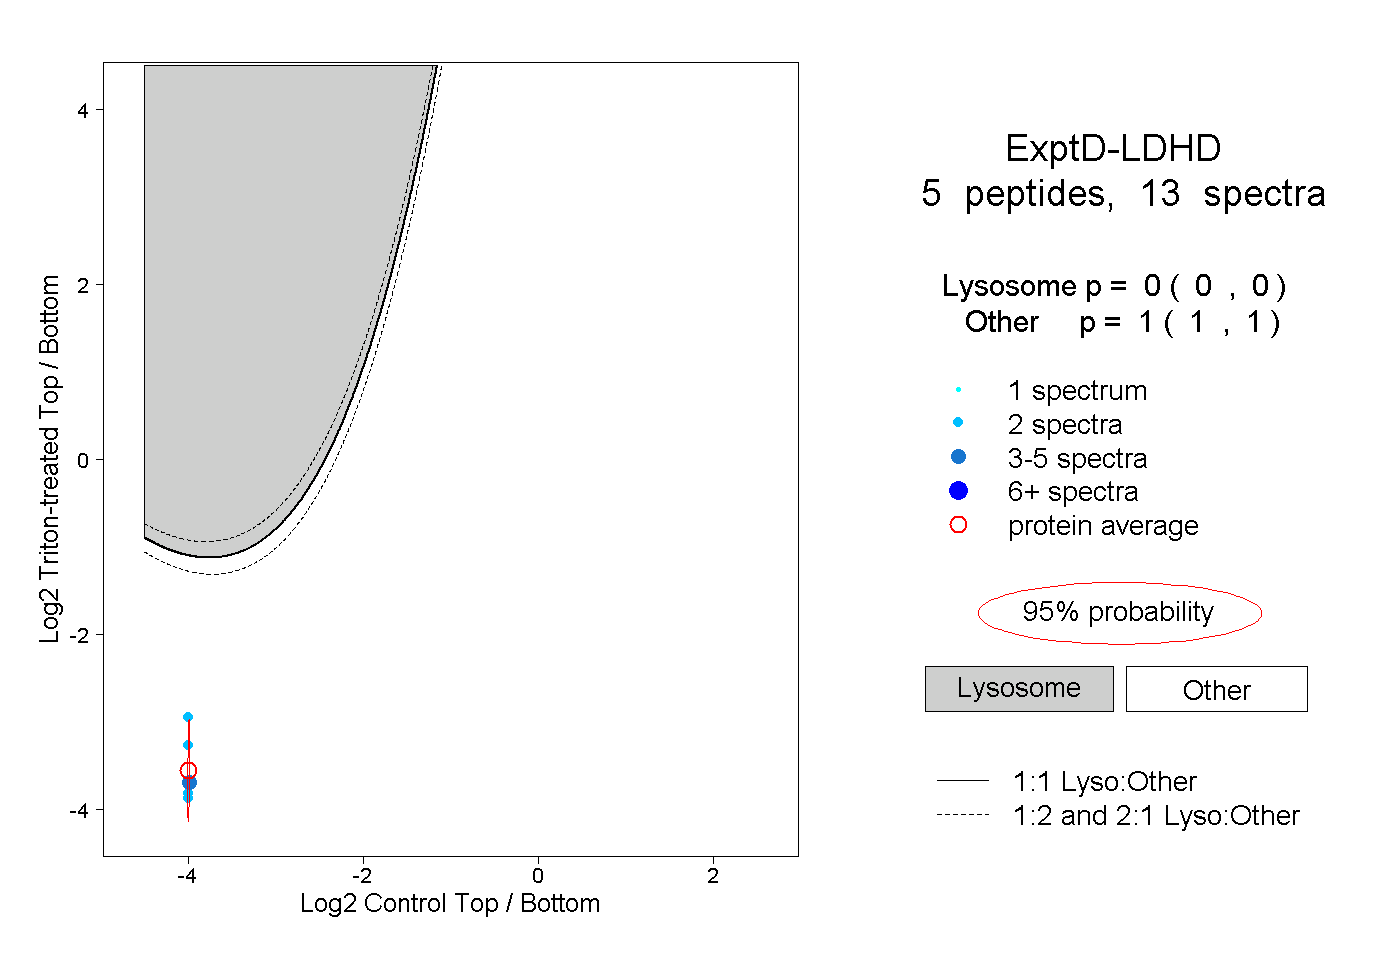 |
0.000 0.000 | 0.000 |
1.000 1.000 | 1.000 |