 2
2peptides
spectra
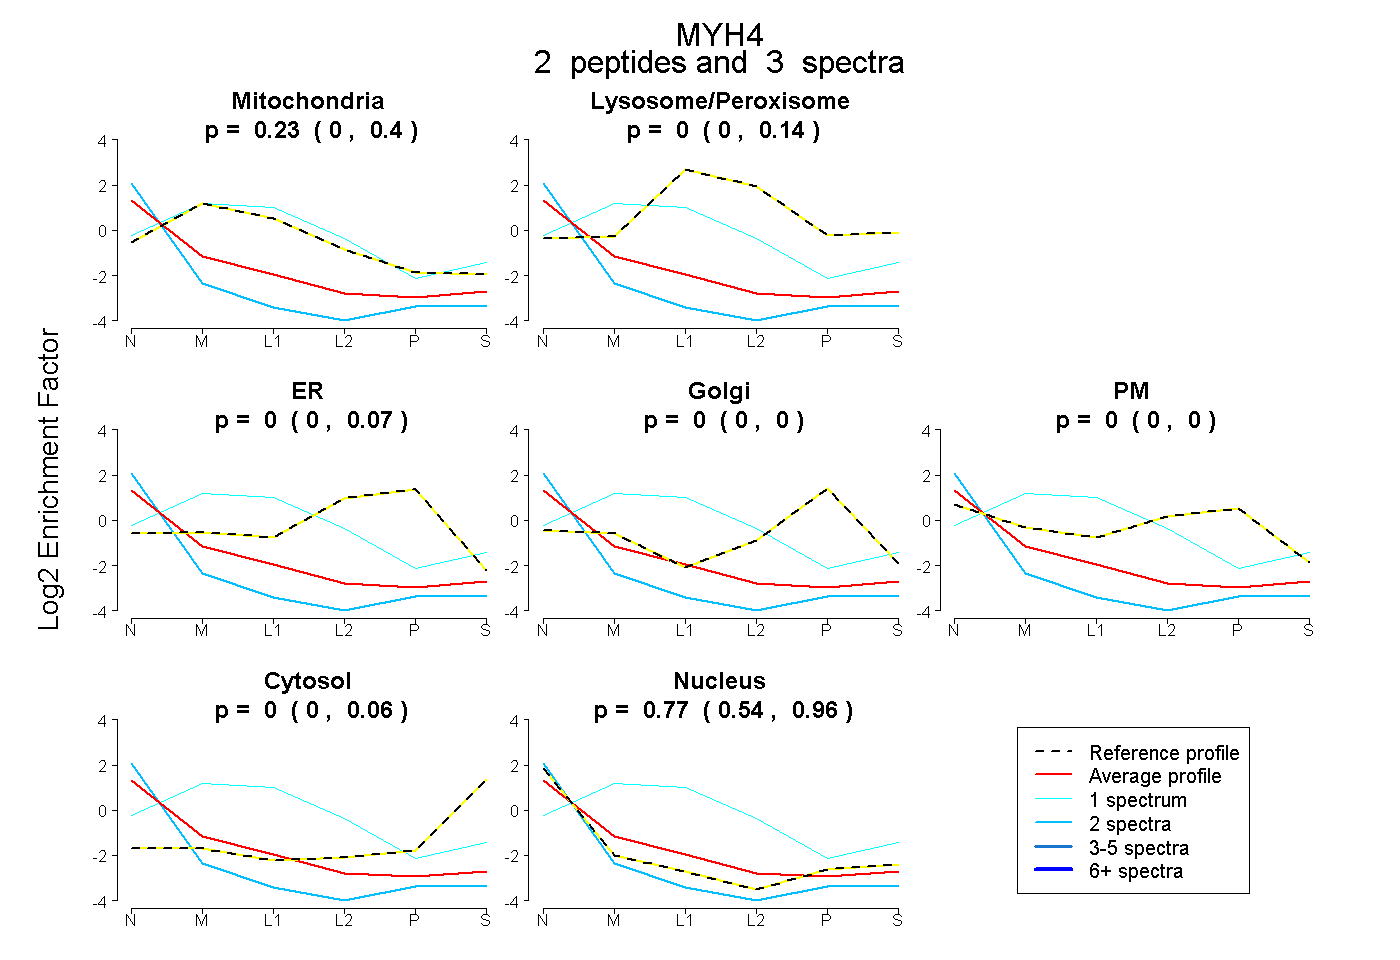
0.000 | 0.396
0.000 | 0.139
0.000 | 0.070
0.000 | 0.000
0.000 | 0.000
0.000 | 0.059
0.544 | 0.957
5peptides
spectra
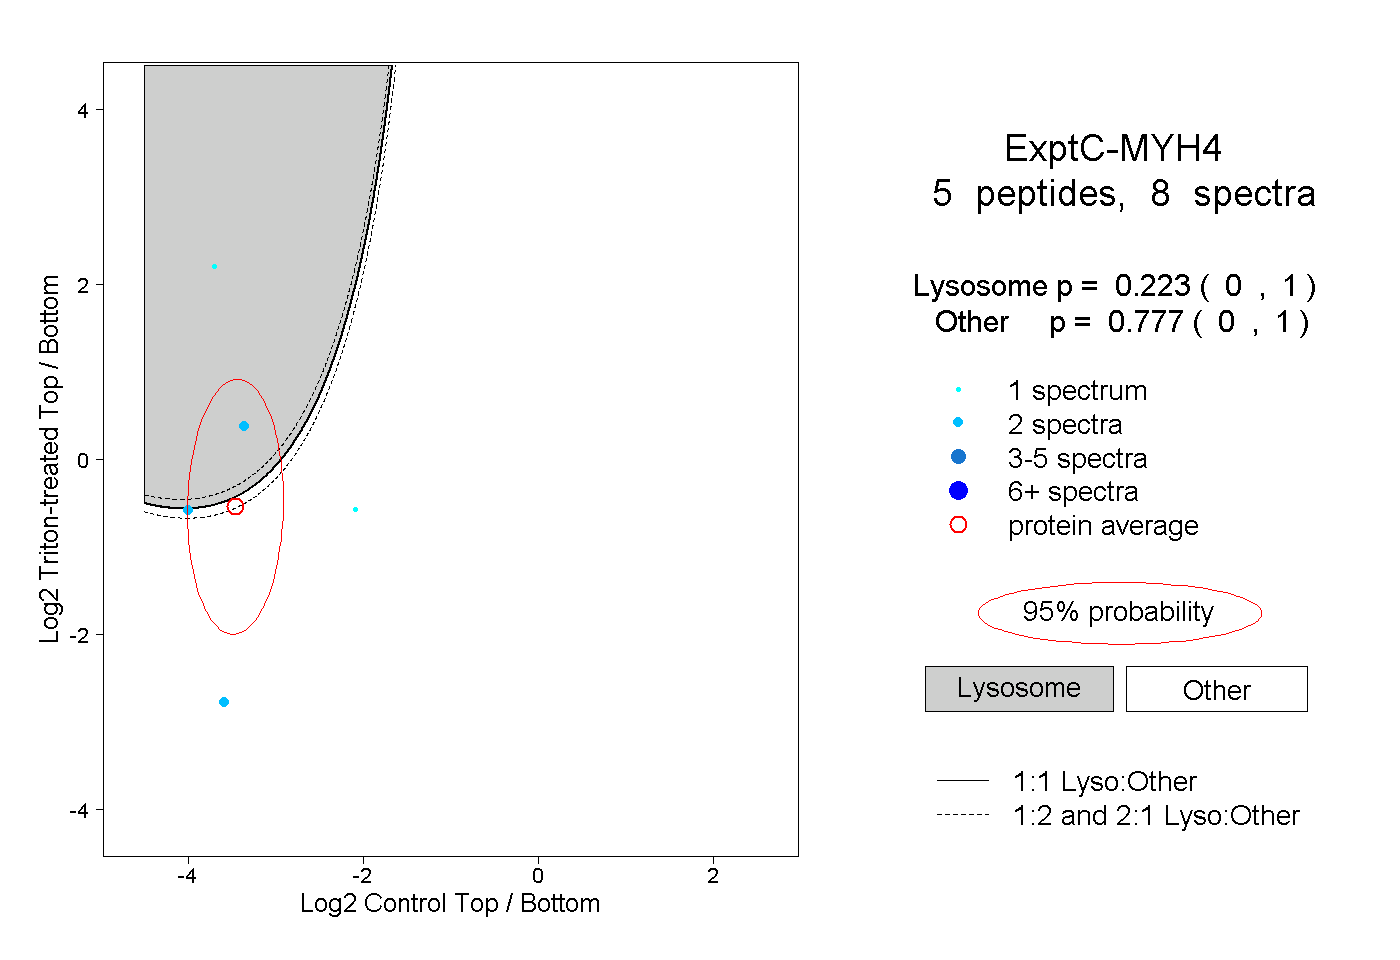
0.000 | 1.000
0.000 | 1.000
1peptide
spectrum
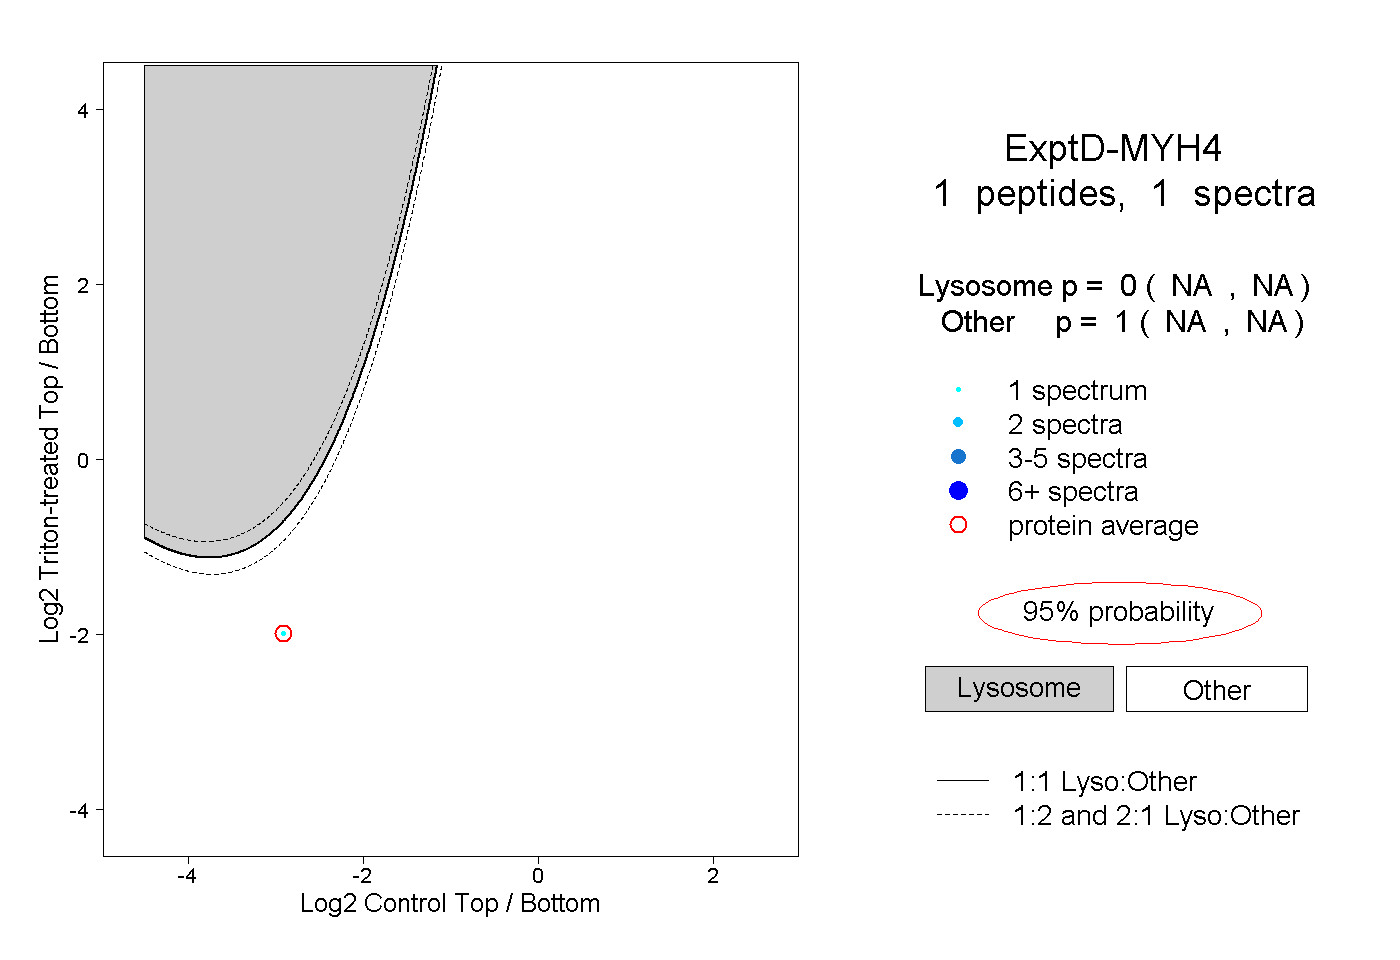
NA | NA
NA | NA