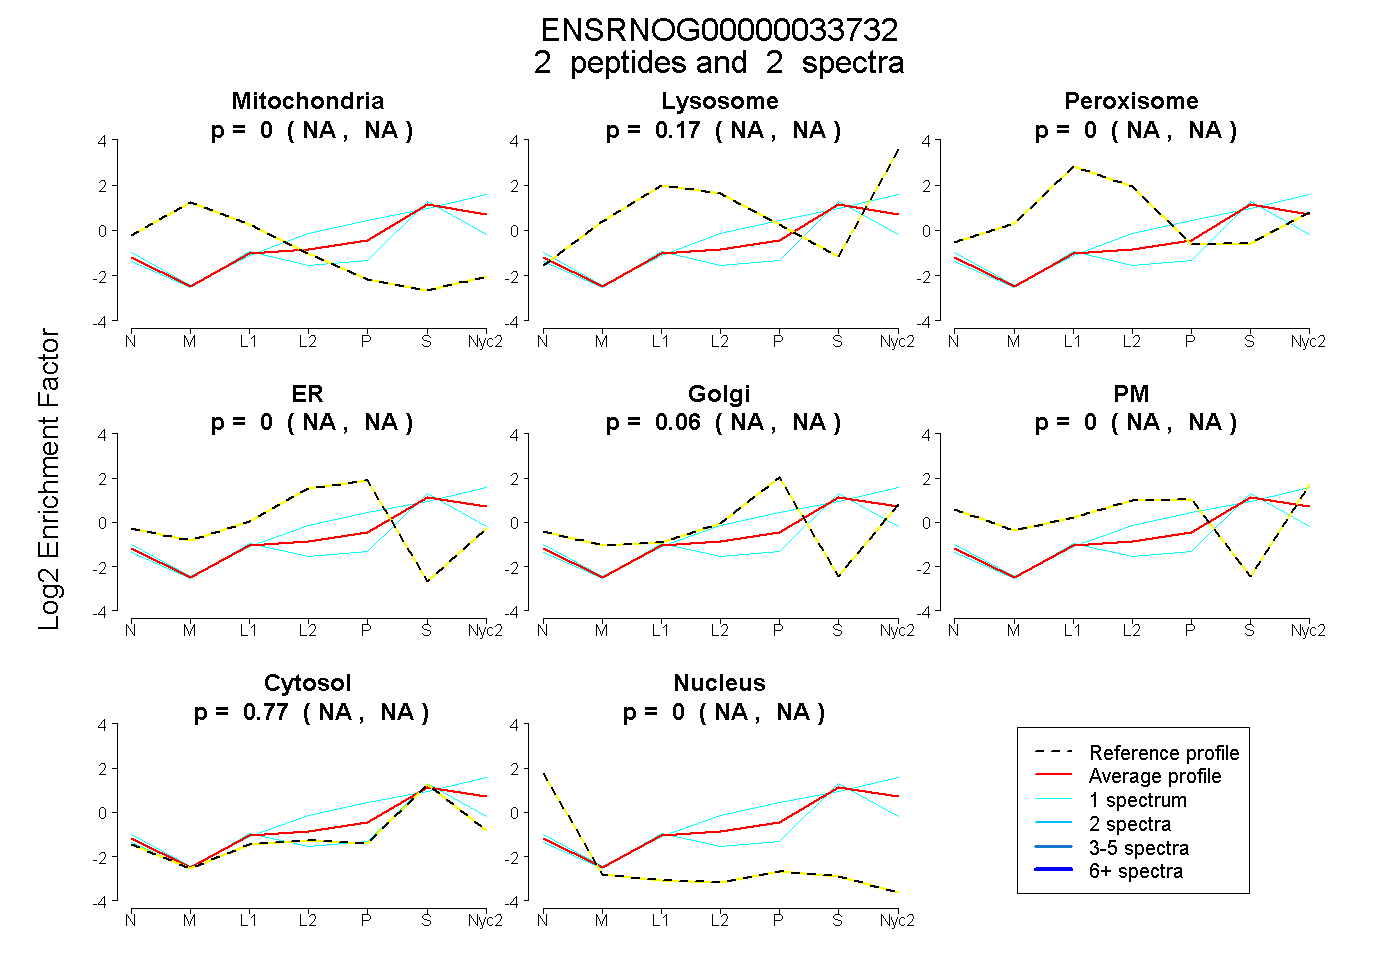
 2
2peptides
spectra
NA | NA
NA | NA
NA | NA
NA | NA
NA | NA
NA | NA
NA | NA
NA | NA
| Plot | Mito | Lyso | Perox | ER | Golgi | PM | Cytosol | Nucleus | |||||
| Expt A |
2 peptides |
2 spectra |
|
0.000 NA | NA |
0.166 NA | NA |
0.000 NA | NA |
0.000 NA | NA |
0.063 NA | NA |
0.000 NA | NA |
0.771 NA | NA |
0.000 NA | NA |
| 1 spectrum, WGDAGAEYVLESTGVFTTMEK | 0.000 | 0.067 | 0.000 | 0.000 | 0.000 | 0.000 | 0.933 | 0.000 | ||
| 1 spectrum, TMDGPSGK | 0.000 | 0.231 | 0.000 | 0.000 | 0.187 | 0.000 | 0.582 | 0.000 |
| Plot | Mito | Lyso or Perox | ER | Golgi | PM | Cytosol | Nucleus | ||||||
| Expt B |
1 peptide |
1 spectrum |
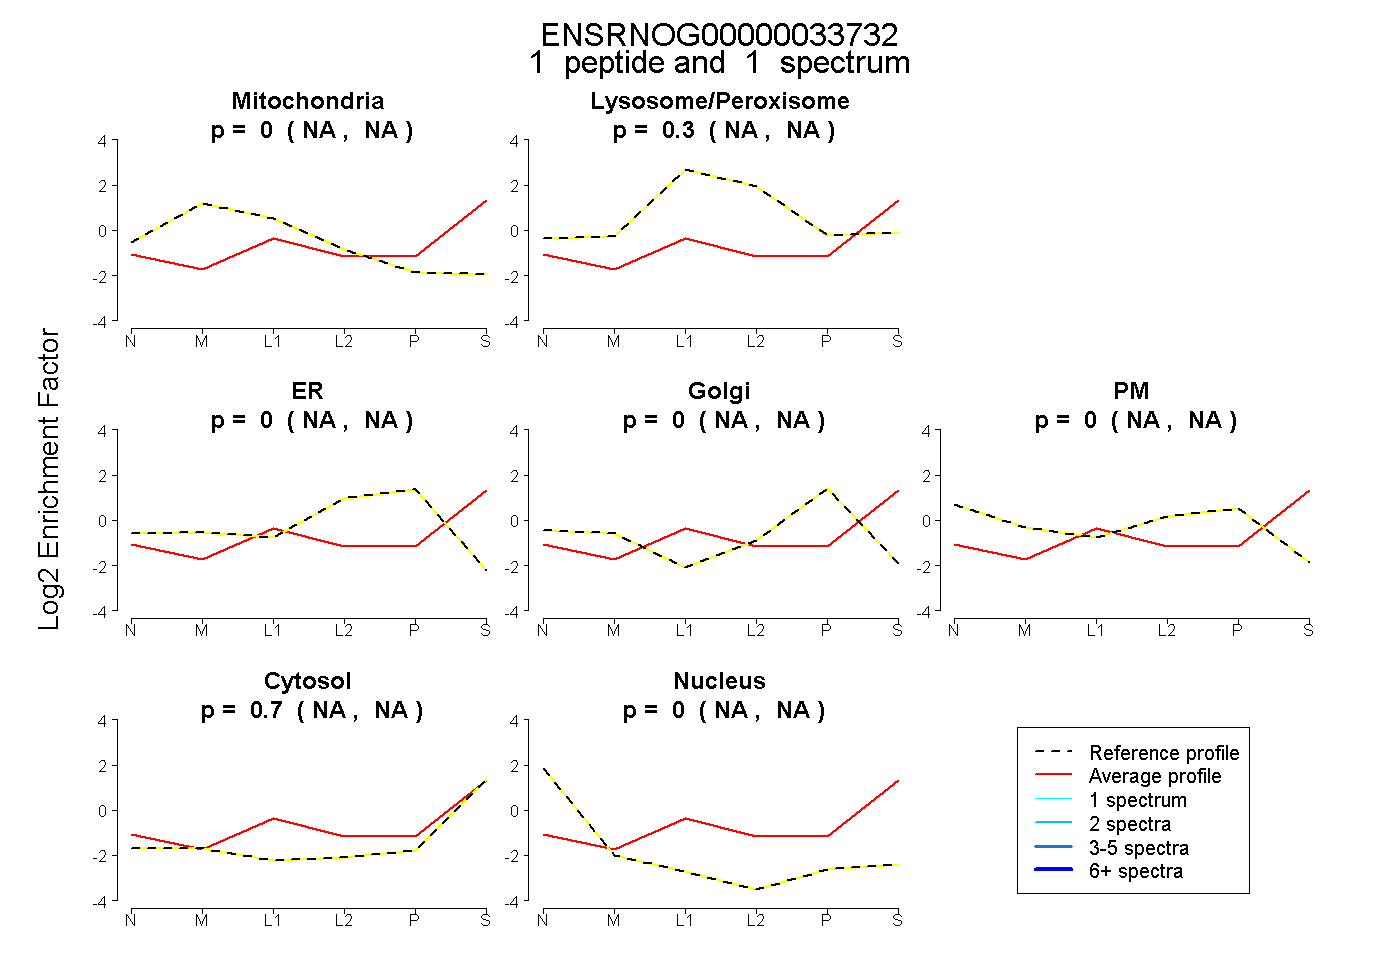 |
0.000 NA | NA |
0.302 NA | NA |
0.000 NA | NA |
0.000 NA | NA |
0.000 NA | NA |
0.698 NA | NA |
0.000 NA | NA |
|||
| Plot | Lyso | Other | |||||||||||
| Expt C |
1 peptide |
1 spectrum |
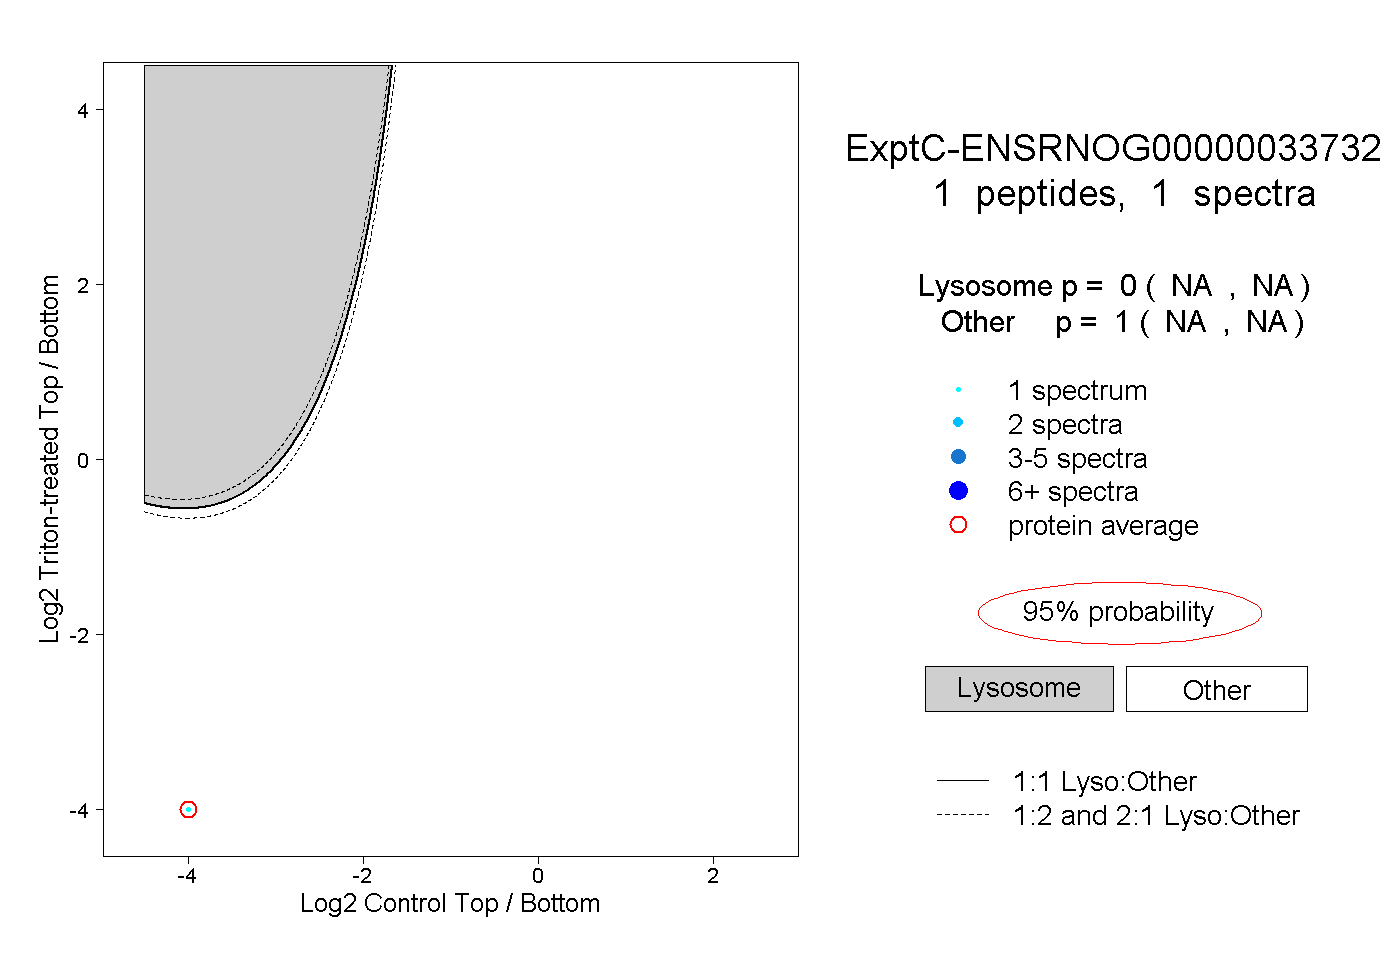 |
0.000 NA | NA |
1.000 NA | NA |