 2
2peptides
spectra
NA | NA
NA | NA
NA | NA
NA | NA
NA | NA
NA | NA
NA | NA
NA | NA
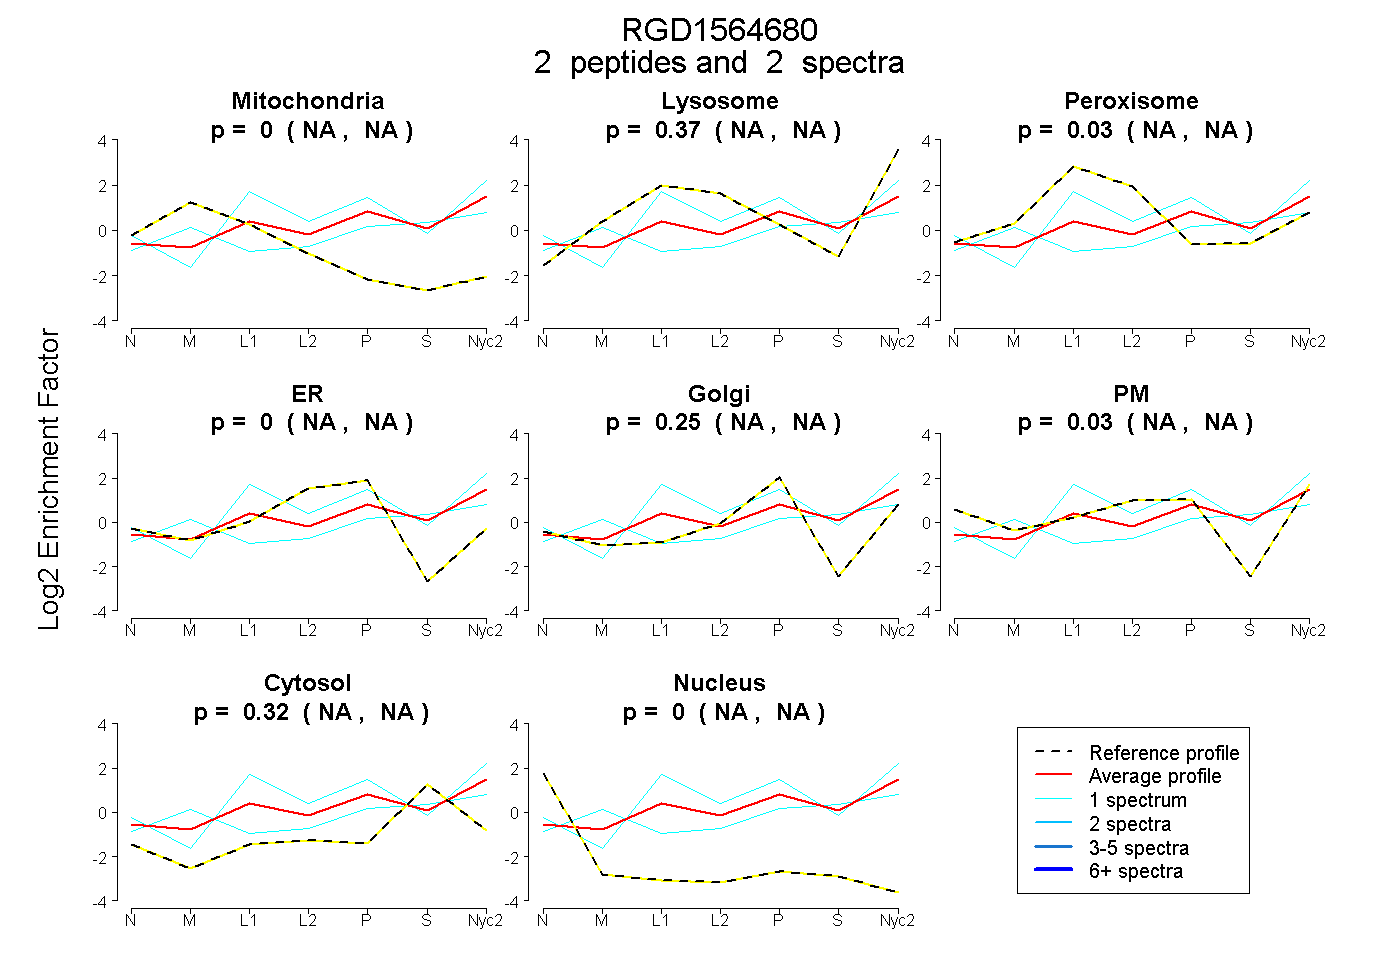
| Plot | Mito | Lyso | Perox | ER | Golgi | PM | Cytosol | Nucleus | |||||
| Expt A |
2 peptides |
2 spectra |
|
0.000 NA | NA |
0.365 NA | NA |
0.034 NA | NA |
0.000 NA | NA |
0.248 NA | NA |
0.030 NA | NA |
0.323 NA | NA |
0.000 NA | NA |
| 1 spectrum, GDEGK | 0.081 | 0.250 | 0.000 | 0.000 | 0.229 | 0.000 | 0.440 | 0.000 | ||
| 1 spectrum, VALDLGTAR | 0.000 | 0.429 | 0.141 | 0.000 | 0.284 | 0.000 | 0.146 | 0.000 |